

Have you ever considered how much data analytics has transformed over the years? In a few short decades, we have moved from manual data entry in spreadsheets to sophisticated data analytics tools that can process vast amounts of information in seconds, all while providing critical business insights.
With the AI revolution in full swing, more advanced tools are entering the data analytics landscape, and choosing the right ones for your business can seem daunting.
In this article, we will showcase the evolution of data storage and processing while also helping you understand the ins and outs of the top data analytics tools available in the market so you can choose the best option for your business today.
The (r)evolution of data storing and processing
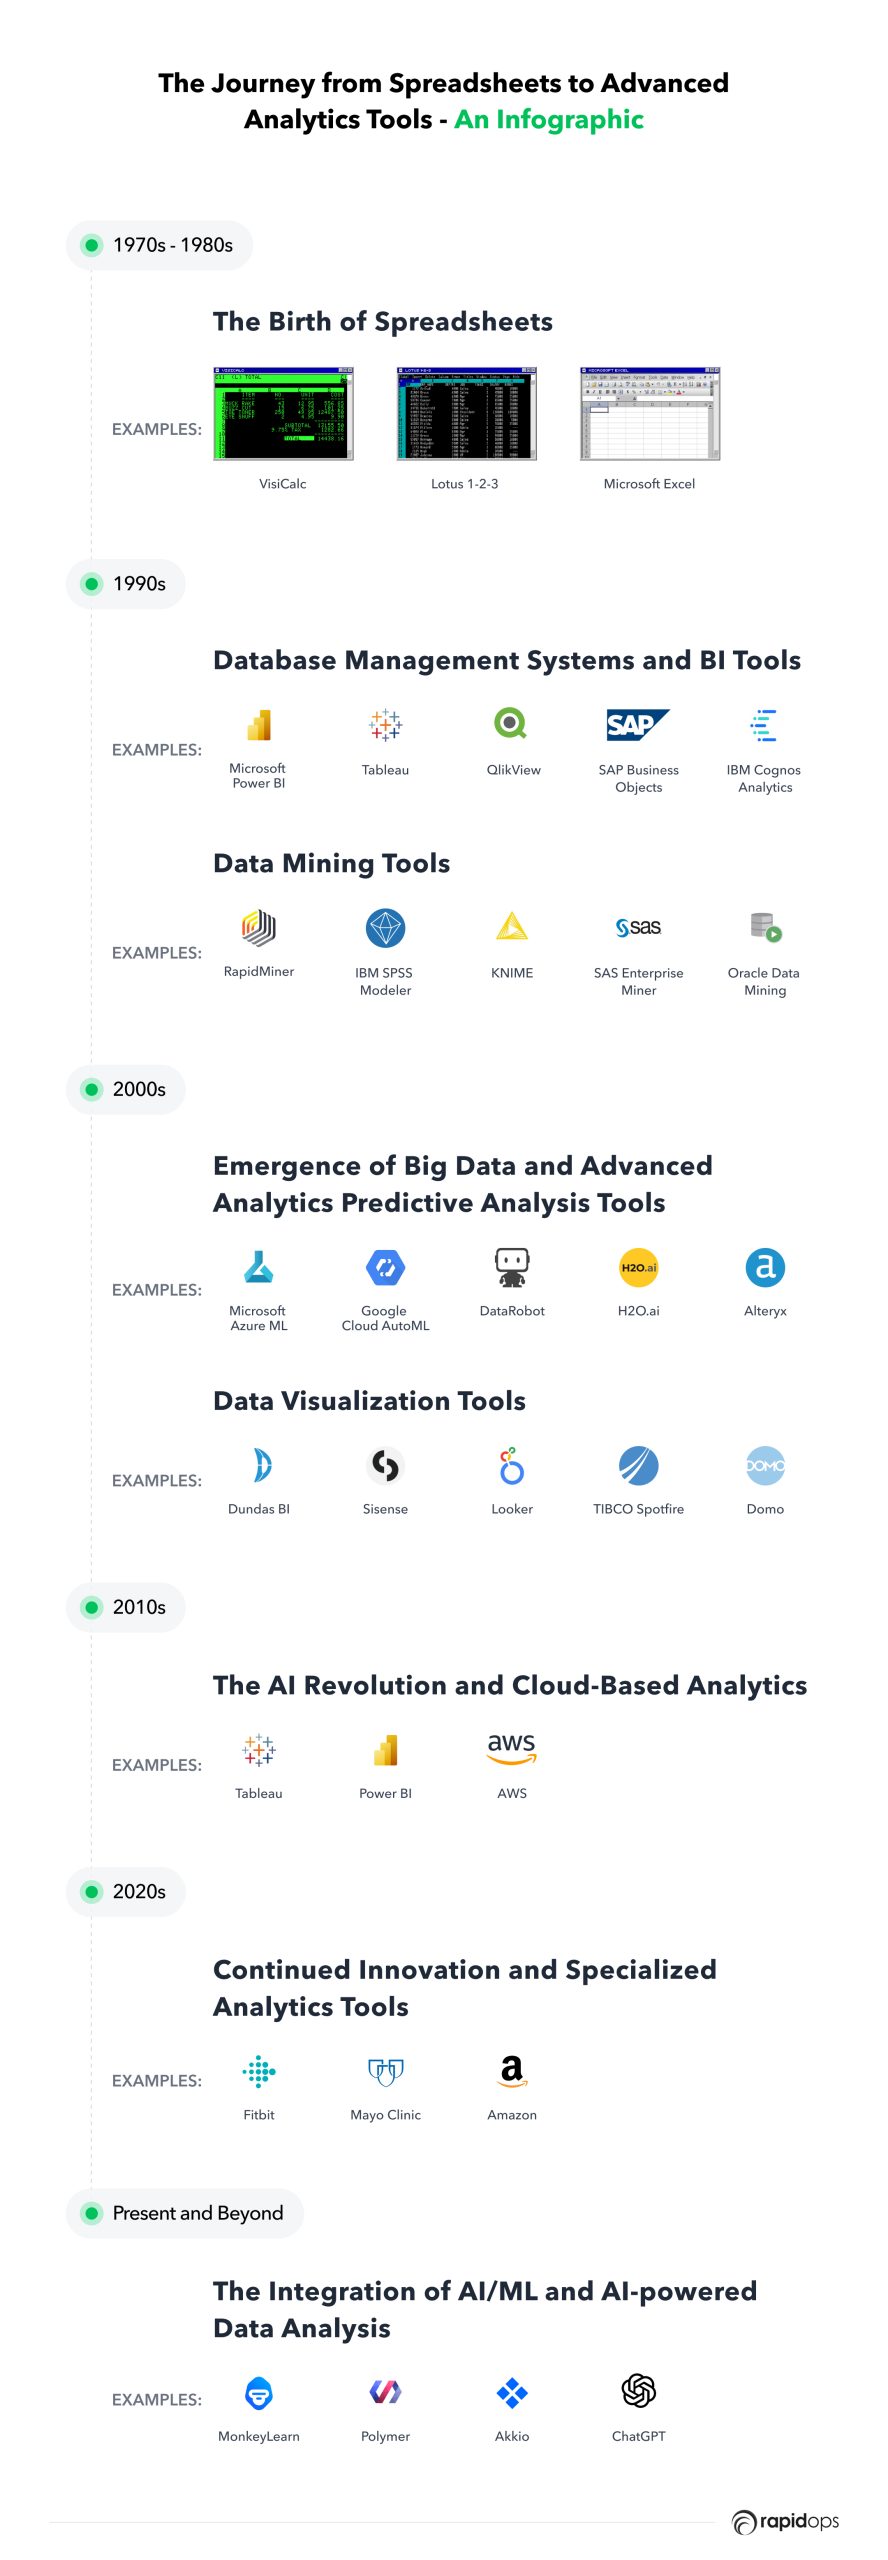
The 1970s-1980s: The birth of spreadsheets
The data analytics journey began with the introduction of spreadsheets in the 1970s and 1980s, revolutionizing how businesses organized and analyzed their data.
Early spreadsheet software like VisiCalc, Lotus 1-2-3, and Microsoft Excel provided a flexible, user-friendly data management and basic analytics platform.
The 1990s: Database management systems and BI tools
The 1990s Brough about a rise in database management systems and business intelligence (BI) tools. These technologies allowed businesses to store, manage, and analyze large volumes of data more efficiently than spreadsheets alone.
Business intelligence (BI) is a term used to describe technologies, tools, and techniques that enable businesses to collect, integrate, analyze, and present information from different sources to support decision-making processes.
The use of BI in businesses dates back to the 1960s, when computers began to be used for data processing.
However, the term "business intelligence" was first used in 1989 by Howard Dresner, then an analyst at Gartner Group, to describe "concepts and methods to improve business decision making by using fact-based support systems."
The first modern BI tool, which allowed users to create interactive reports and perform ad-hoc analysis of data, was released in 1988 by a company called Executive Information Systems.
Since then, many other BI tools have been developed, including data visualization software, data warehousing solutions, and analytics platforms.
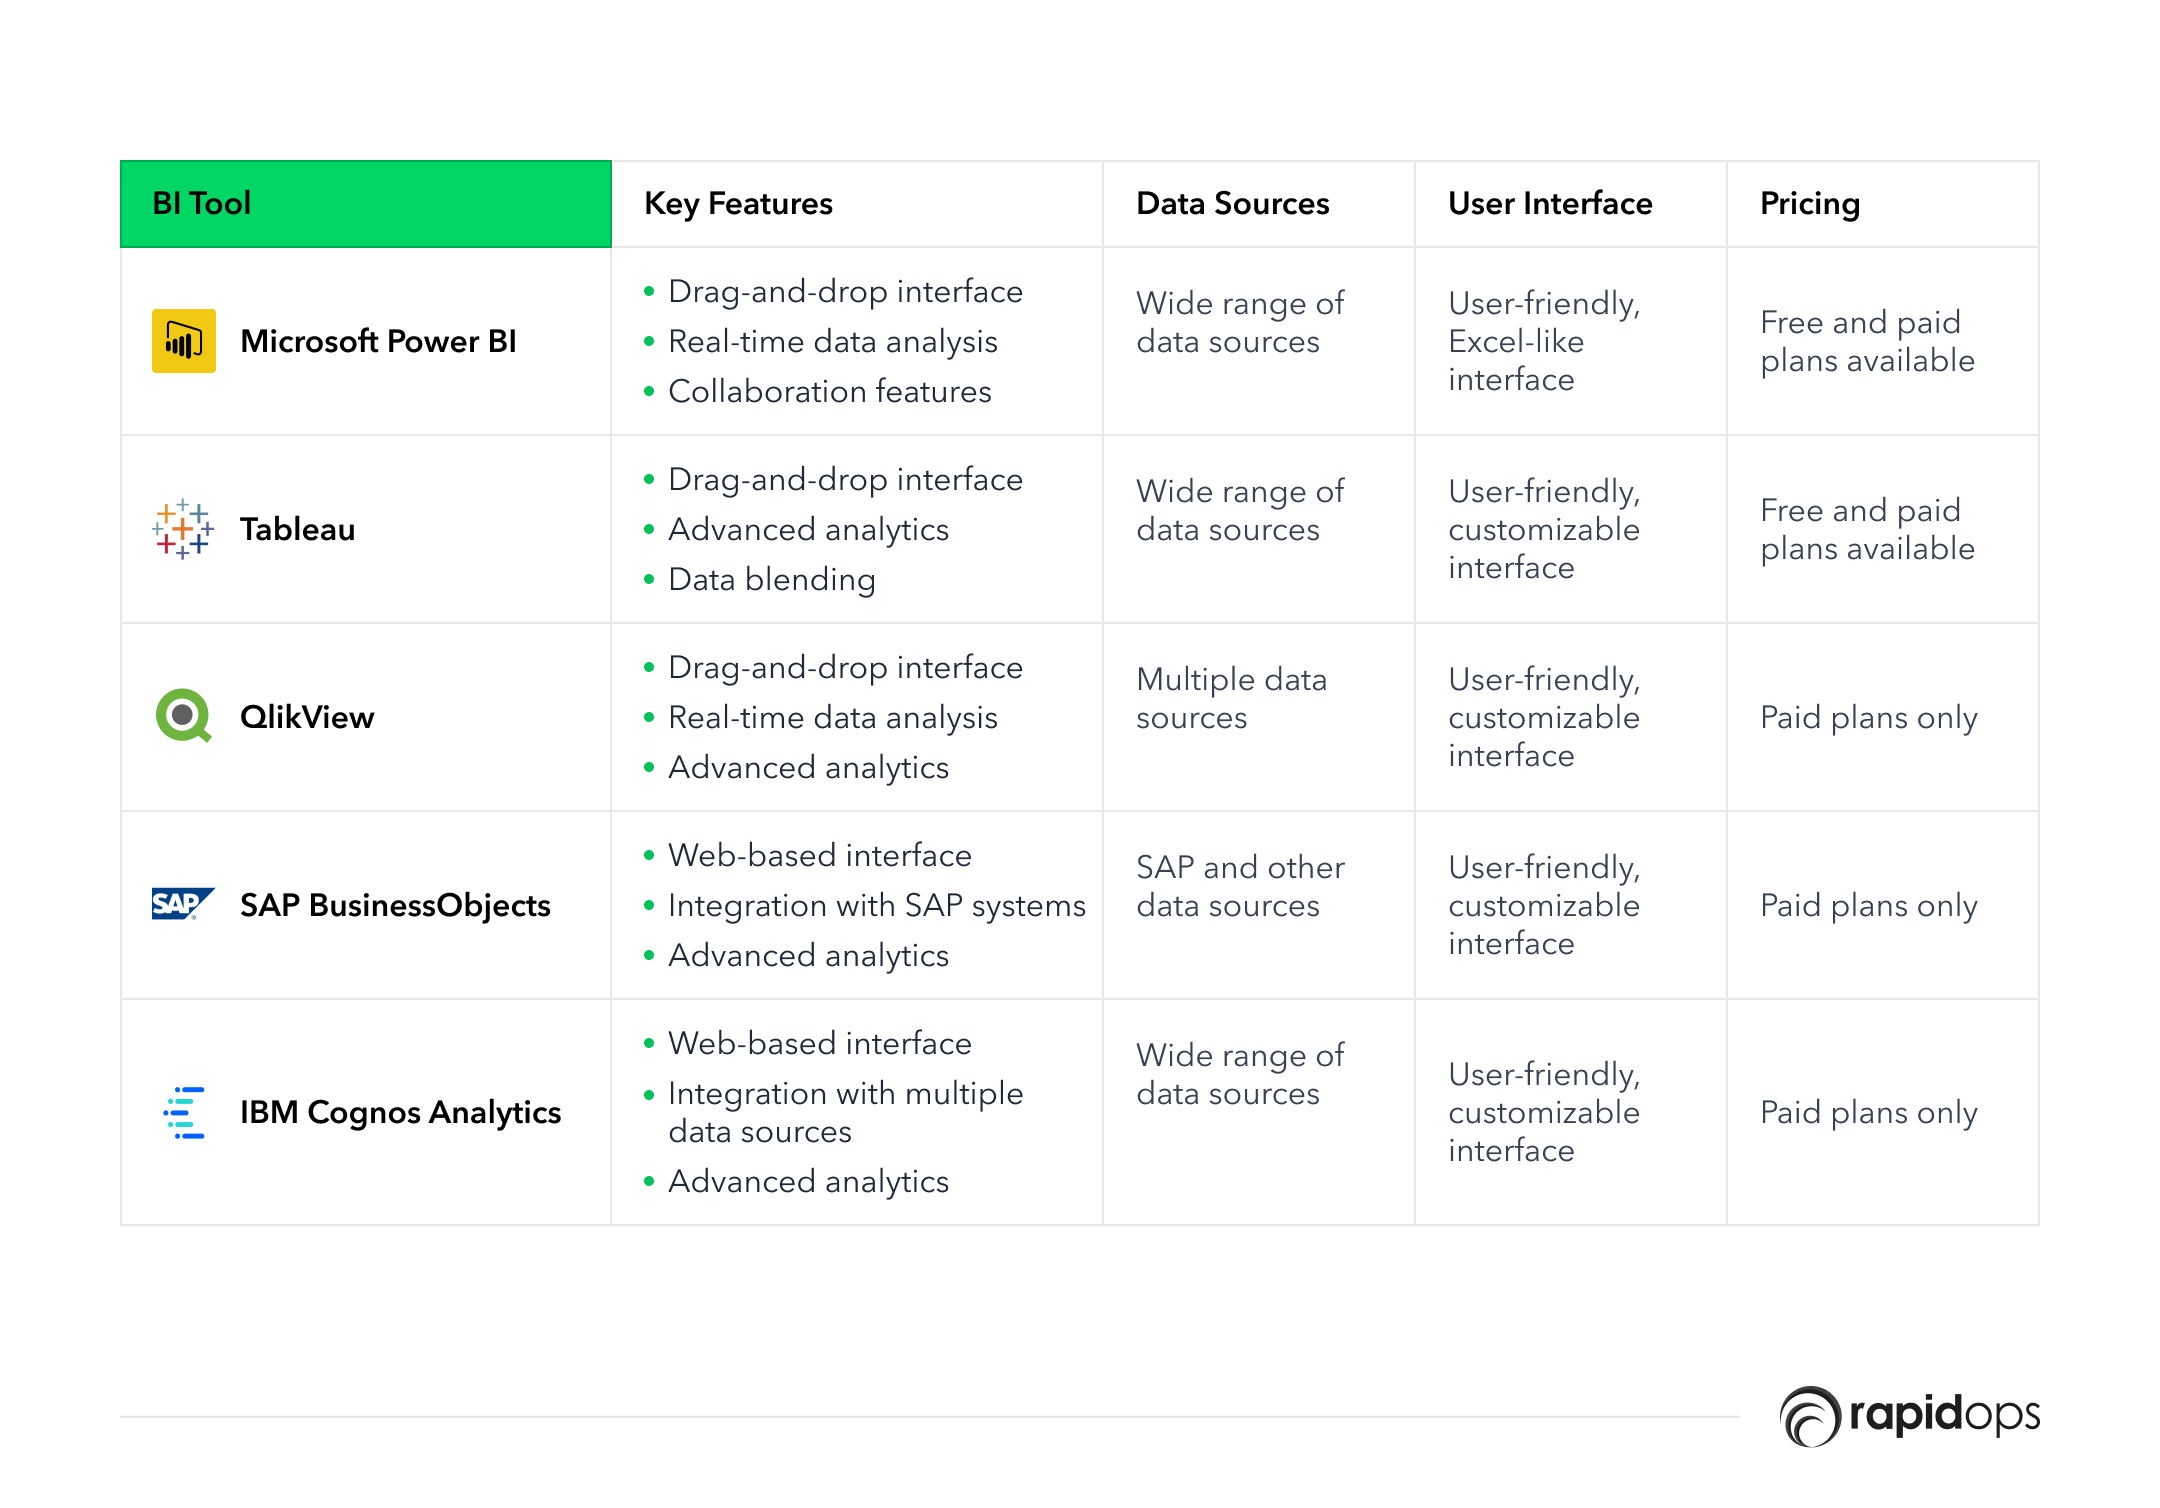
Most widely used BI tools
1. Microsoft Power BI
Microsoft Power BI is a cloud-based BI platform that enables users to create interactive dashboards, reports, and data visualizations. It supports various data sources and offers a user-friendly data exploration and analysis interface.
2. Tableau
Tableau is a popular BI platform that allows users to create interactive data visualizations, dashboards, and reports. It has a user-friendly interface and offers advanced analytics and data discovery features.
3. QlikView
QlikView is a data discovery and visualization tool that enables users to analyze and explore data from multiple sources. It has a powerful data engine and supports real-time data analysis.
4. SAP BusinessObjects
SAP BusinessObjects is a suite of BI tools that includes reporting, dashboarding, and data discovery functionality. It is designed to integrate with SAP systems and supports a wide range of data sources.
5. IBM Cognos Analytics
Cognos Analytics is a BI platform that allows users to create reports, dashboards, and data visualizations. It has a powerful data engine and supports real-time data analysis.
In a nutshell: Microsoft Power BI vs. Tableau vs. QlikView vs. SAP BusinessObjects vs. IBM Cognos Analytics
The inception of data mining tools
Data mining is the process of discovering patterns, relationships, and insights from large amounts of data using statistical, mathematical, and machine-learning techniques.
Data mining tools have been around since the early days of computing, but the term "data mining" became popular in the 1990s.
One of the earliest data mining tools was the Statistical Analysis System (SAS), first developed in the 1970s.
However, it wasn't until the 1990s that data mining tools began to be widely used in businesses, with the introduction of more user-friendly and powerful software packages. The term "data mining" was coined in 1990 by Gregory Piatetsky-Shapiro, a consultant and researcher at the Knowledge Discovery in Databases (KDD) workshop.
The KDD workshop, first held in 1989, brought together researchers and practitioners in data mining, machine learning, and statistics to discuss new techniques for analyzing and extracting knowledge from data.
Since then, data mining has become essential for businesses looking to extract insights from their data and make better decisions.
Data mining tools help businesses to identify patterns and relationships in large datasets. These tools often identify hidden insights and correlations that may not be immediately apparent to the human eye.
Popular data mining tools
1. RapidMiner
RapidMiner is an open-source data mining tool that provides various tools for data integration, transformation, analysis, and visualization. It is designed for data scientists, business analysts, and developers.
It offers a range of machine learning algorithms, including decision trees, regression analysis, and neural networks.
2. IBM SPSS Modeler
IBM SPSS Modeler is a data mining and predictive analytics tool that enables users to build predictive models, perform text analytics, and conduct data mining tasks. It is designed for business analysts, data scientists, and developers.
It has a user base of over 250,000 worldwide and has been recognized as a leader in the Gartner Magic Quadrant for Data Science and Machine Learning Platforms for 2021.
3. KNIME
KNIME is an open-source data analytics platform that provides various data integration, transformation, analysis, and visualization tools.
It is designed for data scientists, business analysts, and developers.
4. SAS Enterprise Miner
SAS Enterprise Miner is a data mining and predictive analytics tool that enables users to build predictive models, perform text analytics, and conduct data mining tasks.
5. Oracle Data Mining
Oracle Data Mining is a data mining tool integrated with the Oracle Database. It enables users to perform data mining tasks within the database, eliminating the need to move data to a separate analytics tool.
Difference: RapidMiner vs. IBM SPSS Modeler vs. KNIME vs. SAS Enterprise Miner vs. Oracle Data Mining
The 2000s: Big Data and advanced analytics
The 2000s marked the emergence of big data and advanced analytics, driven by the exponential growth of digital data and the development of new data processing techniques.
One of the main types of data processing that emerged during that time was business predictive analysis tools, which use statistical algorithms and machine learning techniques to analyze historical data and predict future events or trends.
The use of predictive analytics in business dates back to the 1950s, when organizations began using statistical models to forecast sales, inventory levels, and other business metrics.
However, it wasn't until the 1990s that predictive analytics tools began to be widely adopted in businesses, and more advanced software packages such as SPSS and SAS were introduced.
These tools allowed organizations to analyze large amounts of data and build complex predictive models to forecast future outcomes.
The term "predictive analytics" was coined in the early 2000s by industry analyst Eric Siegel, who wrote the book "Predictive Analytics: The Power to Predict Who Will Click, Buy, Lie, or Die." Siegel defined predictive analytics as "technology that learns from data to predict the future behavior of individuals, processes, or systems."
Since then, predictive analytics has become essential for businesses looking to gain insights into their data and make data-driven decisions by assessing your existing data and understanding their potential.
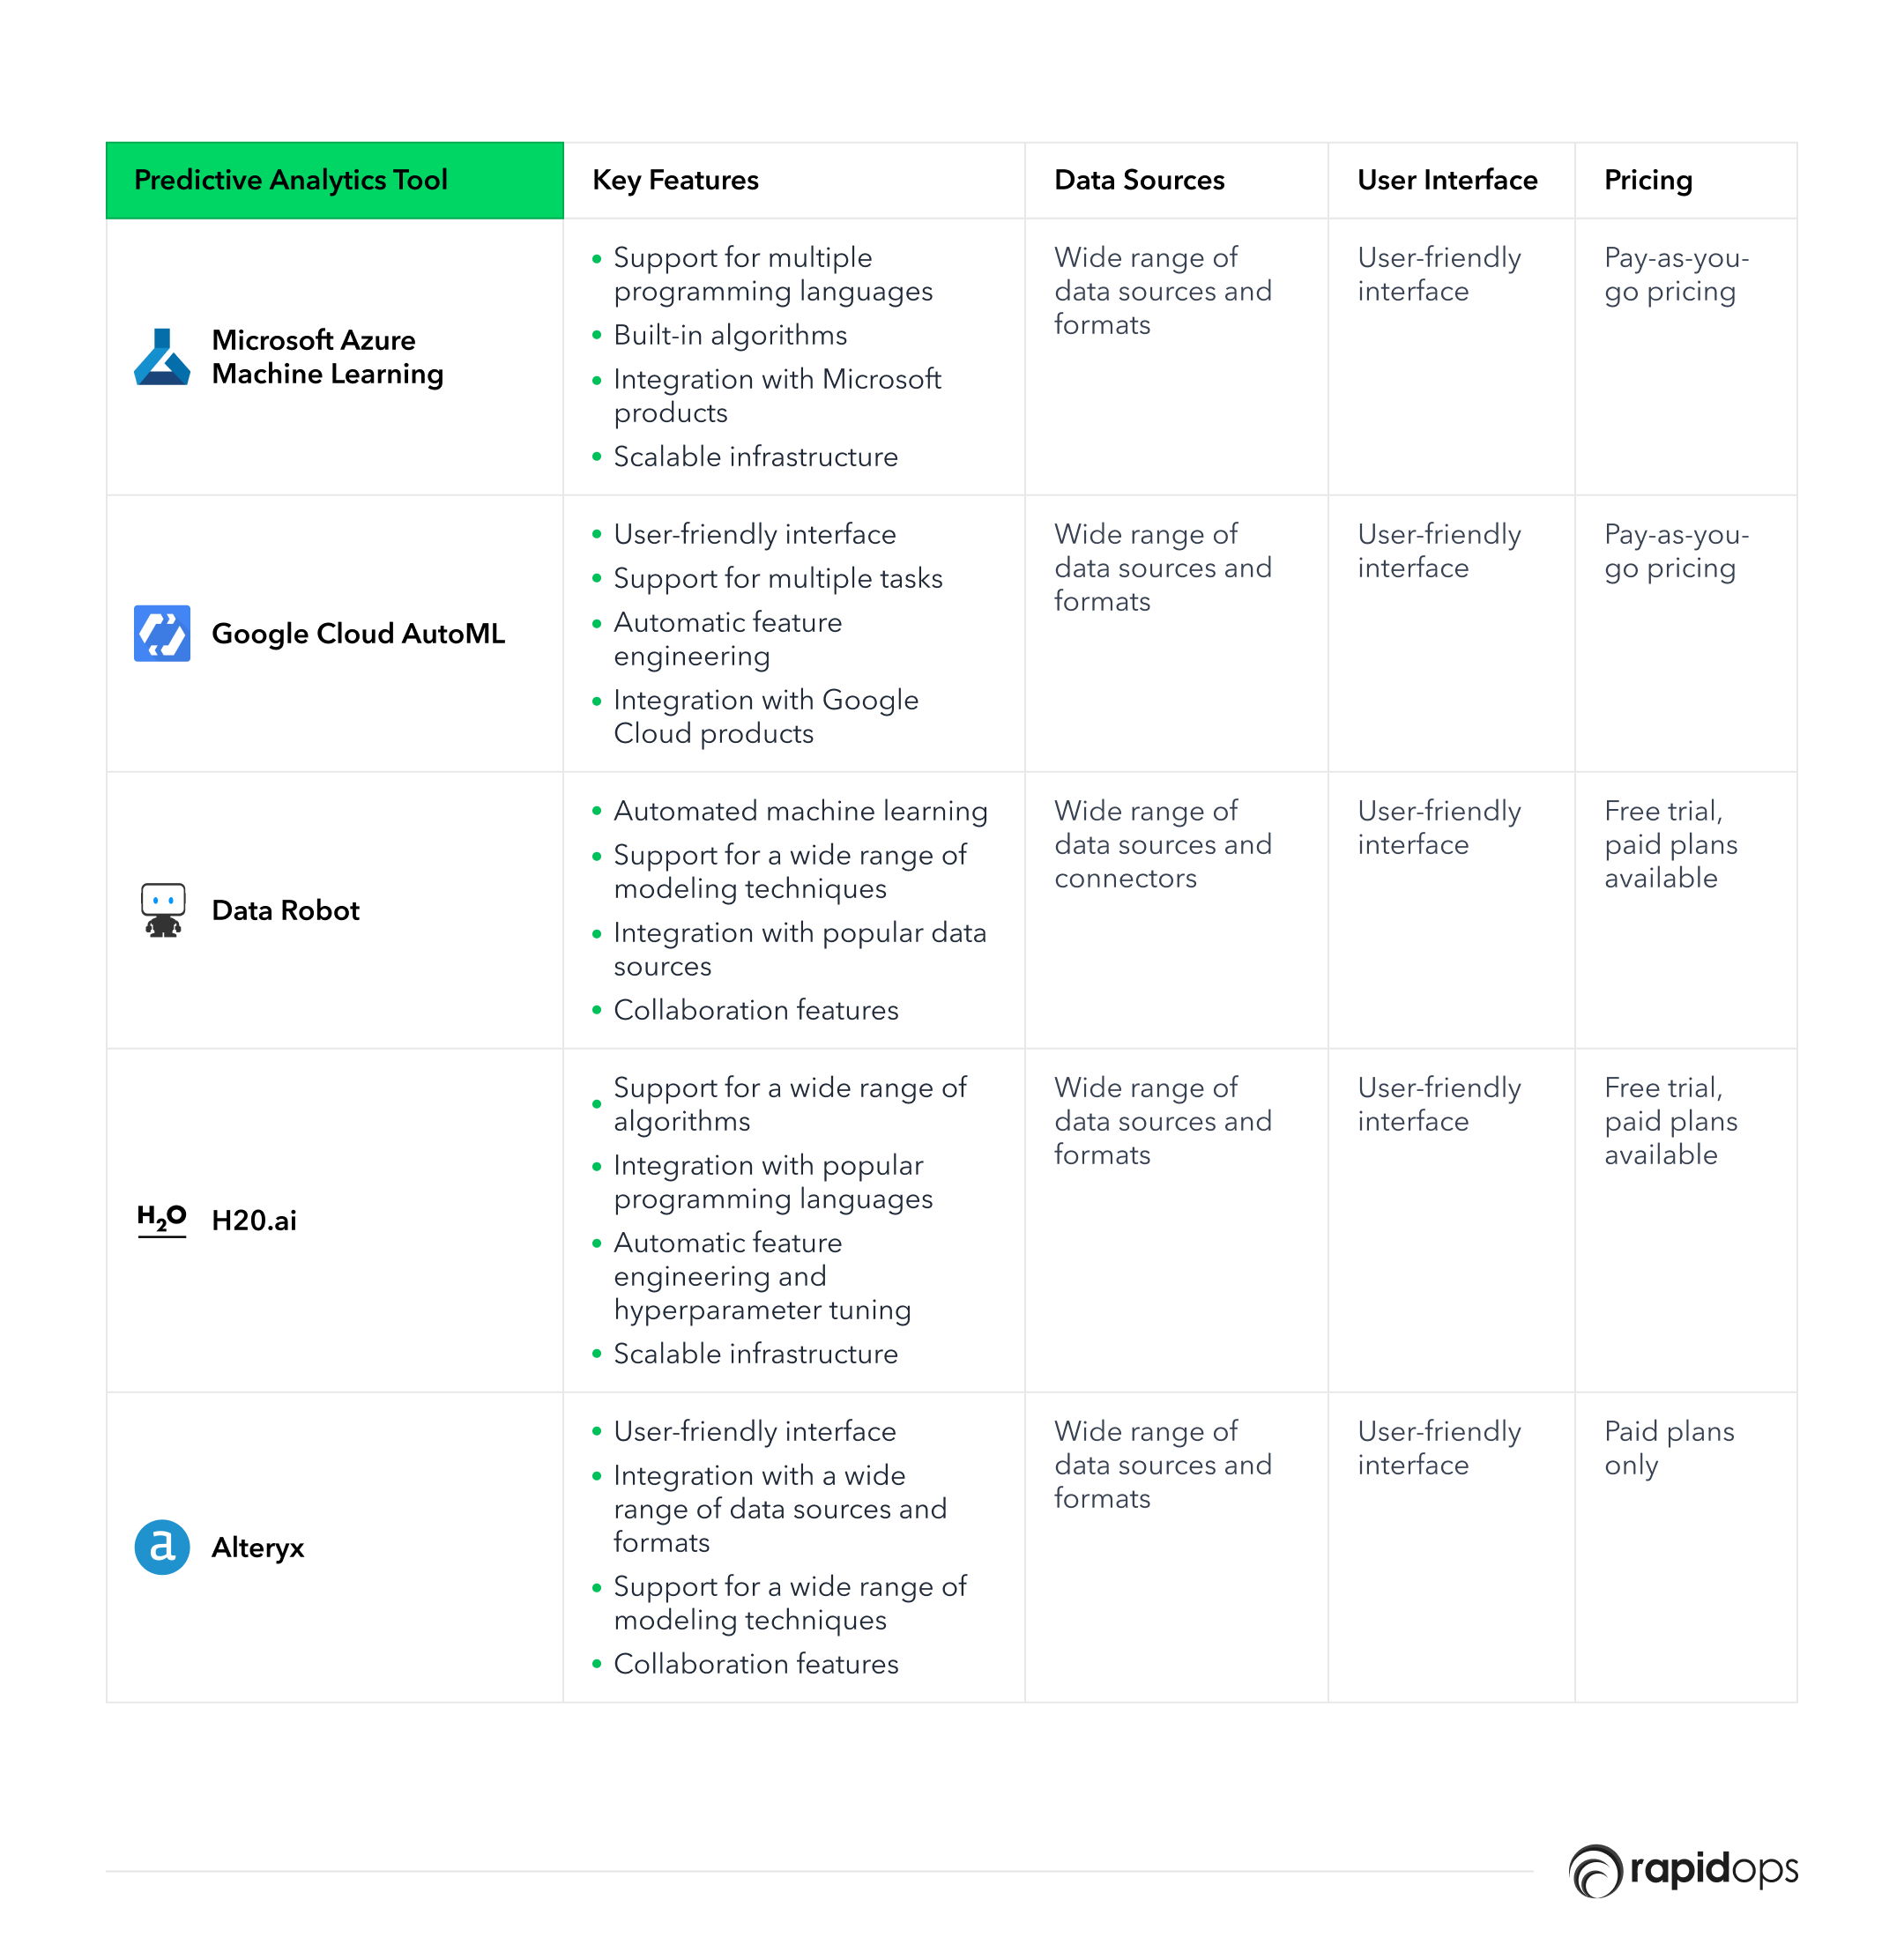
What are the predictive analysis tools?
Predictive analytics tools help businesses forecast future trends and behaviors based on historical data. These tools use statistical models and machine learning algorithms to predict future outcomes and identify opportunities for growth and improvement.
1. Microsoft Azure Machine Learning
Azure Machine Learning is a cloud-based service that enables data scientists and developers to build, train, and deploy machine learning models at scale.
The tool offers an intuitive graphical interface to design machine learning workflows and supports using programming languages such as Python and R for more advanced users.
2. Google Cloud AutoML
AutoML is a suite of machine learning tools offered by Google Cloud that allows users to build custom machine learning models without extensive programming experience.
AutoML includes various tools that can be used for tasks like image and video analysis, natural language processing, and structured data analysis.
3. DataRobot
DataRobot is an AI platform that enables businesses to build and deploy machine learning models quickly and easily.
The tool automates the entire machine learning process, from data preparation to model deployment, making it accessible to users with various experience levels.
4. H2O.ai
H2O.ai is an open-source machine learning platform that enables users to build and deploy predictive models for various tasks, including fraud detection, customer churn prediction, and sentiment analysis.
The tool supports a range of algorithms and frameworks, including TensorFlow, and offers an intuitive graphical interface for designing machine learning workflows.
5. Alteryx
Alteryx is a data preparation and analytics tool that offers machine learning capabilities for various tasks, such as predictive modeling, time-series forecasting, and anomaly detection.
The tool includes a drag-and-drop interface that enables users to easily clean, transform, and blend data from various sources without requiring extensive coding knowledge.
Divergence: Microsoft Azure ML vs. Google Cloud AutoML vs. DataRobot vs. H2O.ai vs. Alteryx
Along with business predictive analysis tools, data visualization tools came into the limelight.
The prominent data visualization tools
Data visualization is the graphical representation of data and information. It helps businesses to understand complex data and identify patterns and trends quickly.
The use of data visualization in businesses dates back to the early days of computing when businesses began to use charts and graphs to represent data visually.
However, the launch date of modern data visualization tools can be traced back to the 1970s, when John Tukey, an American statistician, introduced the concept of exploratory data analysis.
Tukey believed that data visualization could be used to understand complex data and explore relationships between variables.
In the 1980s and 1990s, computer graphics and the widespread adoption of personal computers led to the development of more advanced data visualization tools. The first data visualization software, VisiCalc, was released in 1979, enabling users to create simple bar charts and line graphs on their computers.
The term "data visualization" was first used in the late 1990s by Stuart Card, a researcher at Xerox PARC. Stuart described data visualization as "using computer-supported, interactive, visual representations of abstract data to amplify cognition."
Since then, data visualization has become an essential tool for businesses exploring and communicating insights from their data.
Data visualization tools help businesses to create visual representations of their data, such as charts, graphs, and maps. These tools are ideal for companies that need to communicate complex data in a way that is easy to understand.
Let's see the most used data visualization tools:
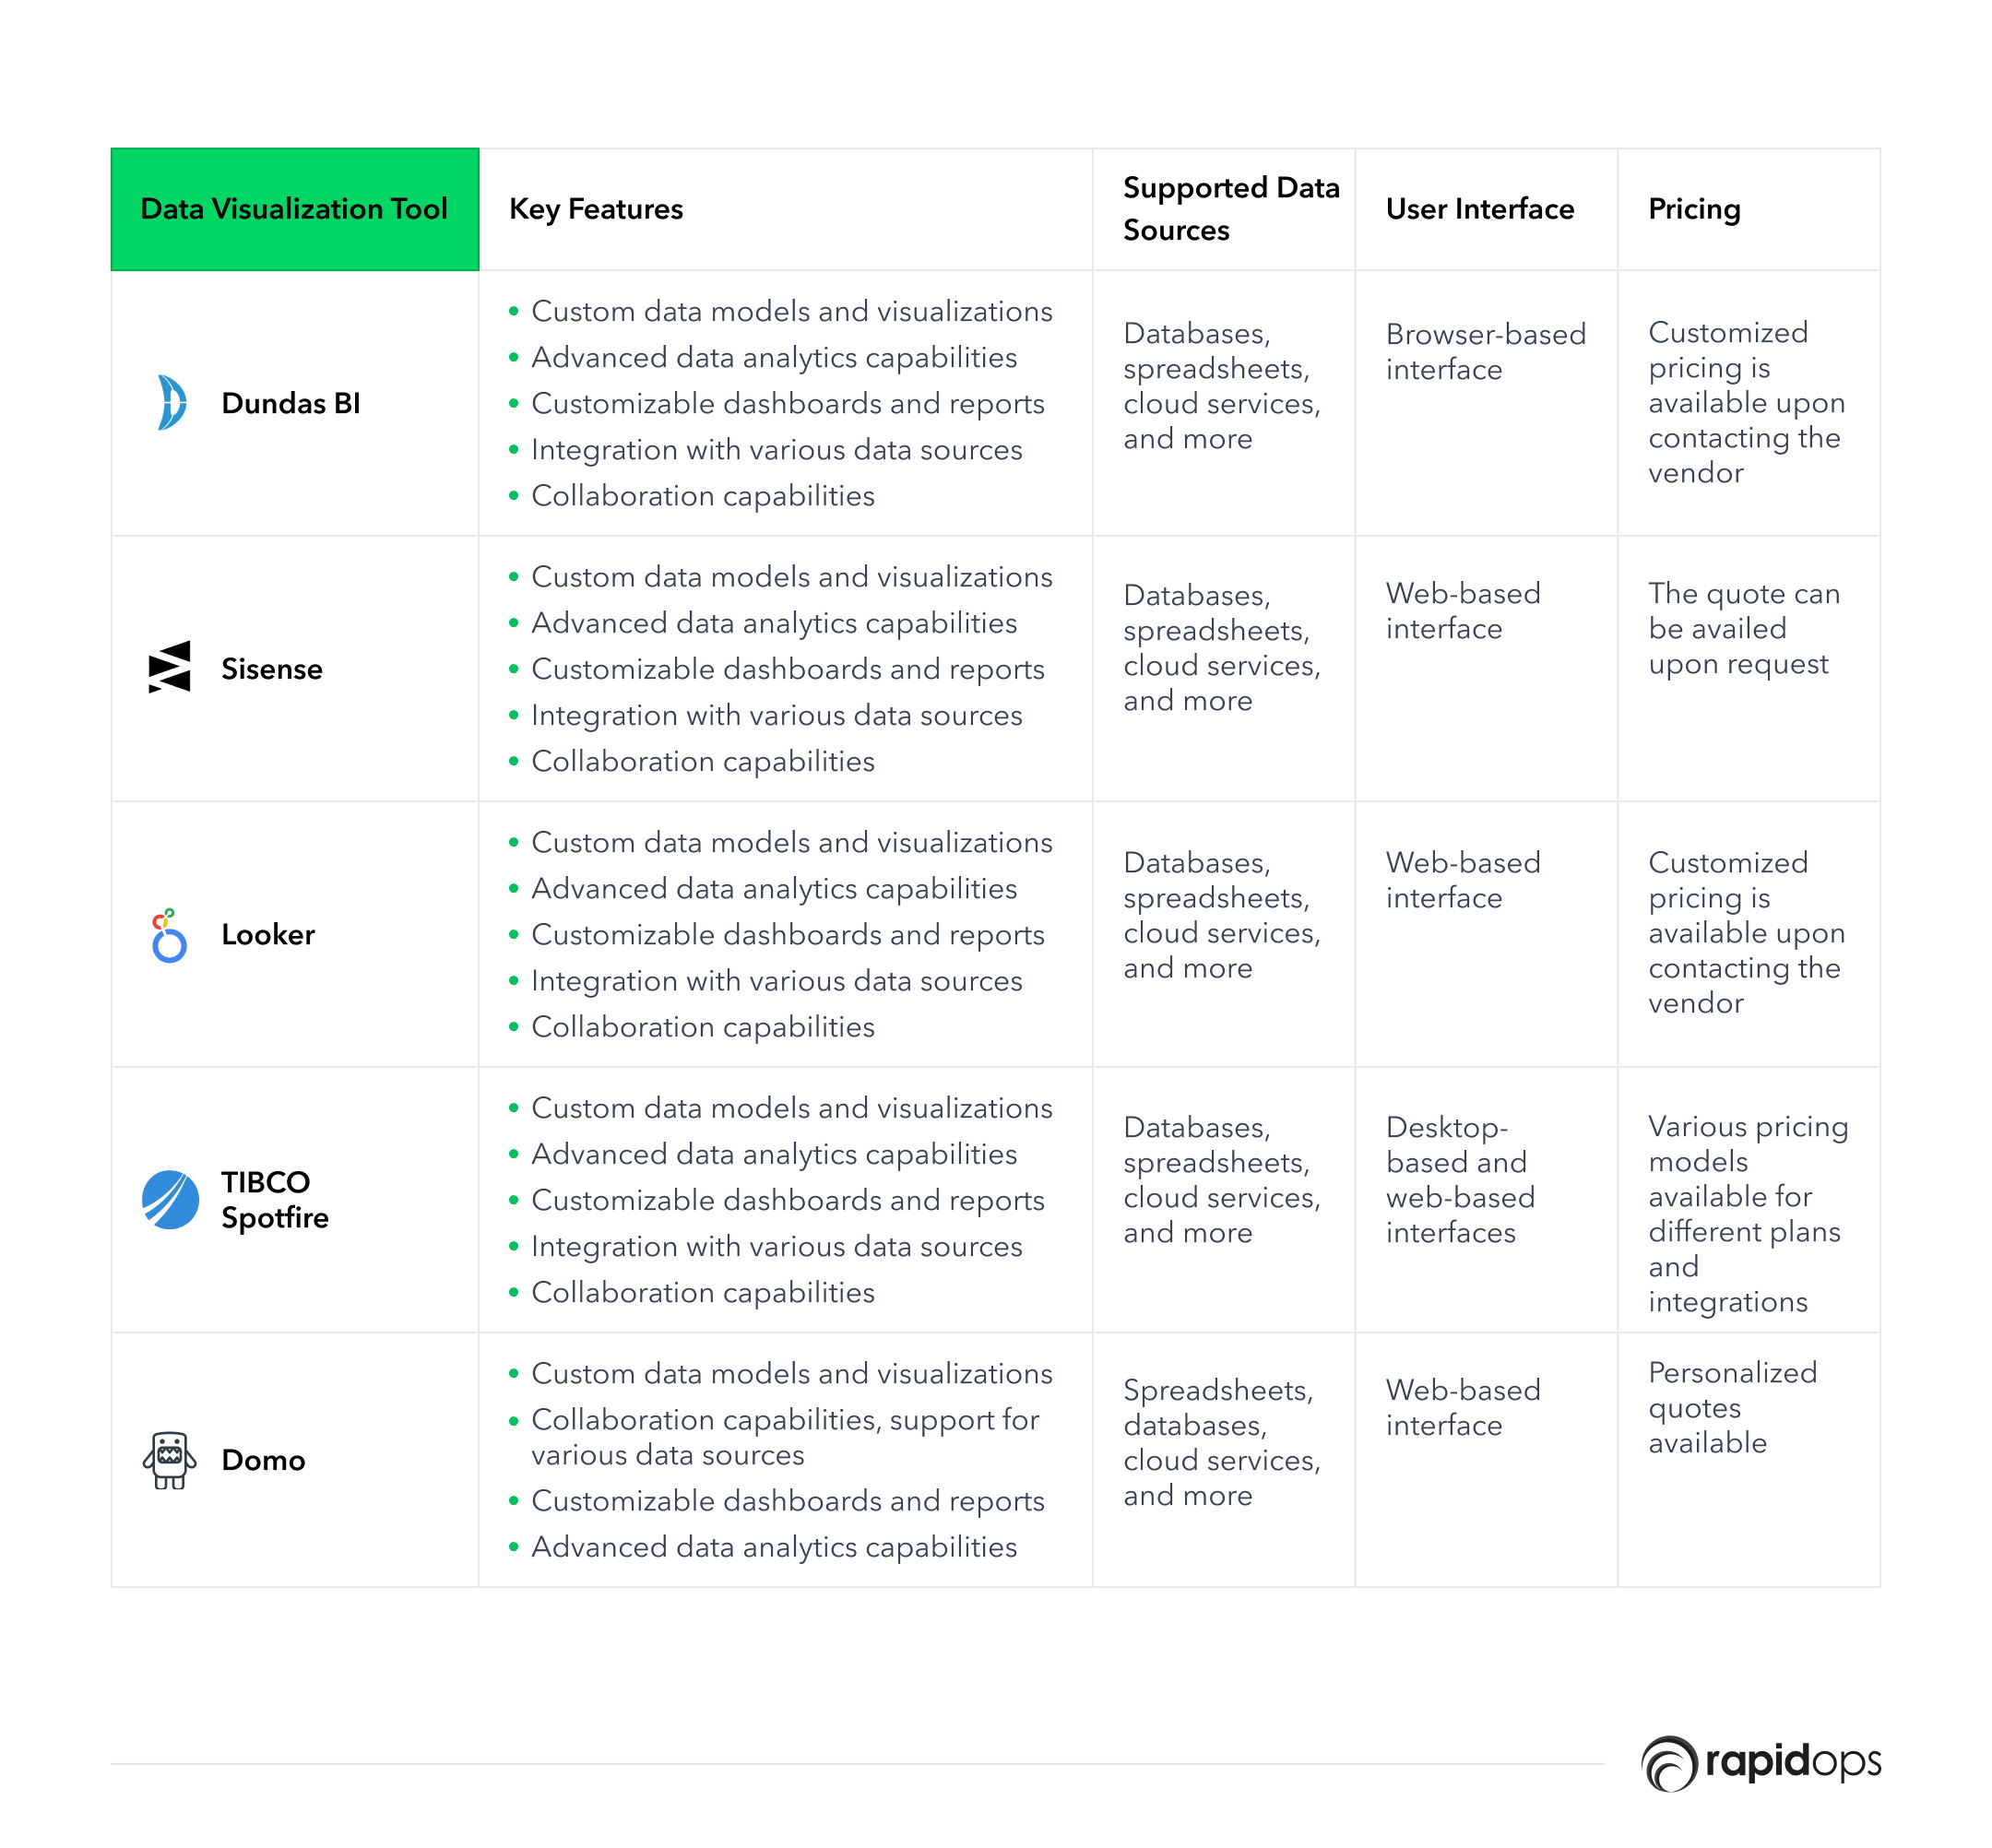
Top data visualization tools
1. Dundas BI
Dundas BI is a data visualization and business intelligence platform that allows users to create interactive dashboards, reports, and analytics from various data sources.
It lets users connect to various data sources, including databases, cloud applications, and web services.
In addition, the platform offers a range of data modeling and preparation tools to help users transform and manipulate their data and includes advanced analytics capabilities such as predictive modeling and machine learning.
2. Sisense
Sisense's data preparation and modeling tools enable users to transform and cleanse data, create calculated fields, and define relationships between data sources.
One of the critical strengths of Sisense is its ability to handle large and complex datasets. The platform uses a columnar database architecture and in-memory processing to enable fast querying and analysis of large datasets.
3. Looker
Looker lets users connect to various data sources, including databases, spreadsheets, and cloud-based services like Salesforce and Google Analytics.
The platform offers a variety of visualization options, including bar, line, and pie charts, as well as more advanced options like Sankey diagrams and sunburst charts. In addition, Looker's custom visualization API allows users to create and share their visualizations.
4. TIBCO Spotfire
Spotfire offers a variety of features and capabilities, including data preparation and modeling, interactive dashboards and visualizations, and predictive analytics.
It can connect to various data sources, including databases, spreadsheets, cloud applications, and web services. It also includes built-in connectors to popular data sources like Salesforce, Amazon Redshift, and Google BigQuery.
Spotfire offers a variety of visualization options, including charts, tables, and maps, as well as more advanced options like heat maps, tree maps, and network graphs.
5. Domo
Domo's data preparation and modeling tools enable users to transform and cleanse data, create calculated fields, and define relationships between data sources.
It also includes collaboration features that allow teams to work together on data analysis and reporting. This includes features like commenting, sharing, and annotation.
Face-off: Dundas BI vs. Sisense vs. Looker vs. TIBCO Spotfire vs. Domo Dundas BI
The 2010s: The AI revolution and cloud-based analytics
The 2010s witnessed the AI revolution and the rise of cloud-based analytics. Machine learning and AI capabilities were integrated into data analytics tools, enabling more accurate predictions and automation of data analysis processes.
Cloud-based platforms like Tableau, Power BI, and Amazon Web Services (AWS) made it easier for businesses to access and analyze their data, regardless of scale or location.
The 2020s: Continued innovation and specialized analytics tools
The 2020s saw continued innovation in data analytics, with more specialized tools catering to specific industries and use cases.
Healthcare, supply chain, and technology sectors benefited from tailored solutions that addressed their unique challenges.
Tools like Fitbit for health monitoring, Amazon's big data analytics for supply chain optimization, and Mayo Clinic's analytics for patient care demonstrate the impact of targeted data analytics solutions.
Present and Beyond: The integration of GPT and AI-powered data analysis
With OpenAI's GPT-3 release, businesses now have access to advanced data analytics capabilities.
GPT-3 can accept text inputs of up to 2048 characters and generate responses with high coherence and relevance.
GPT-3's language processing abilities have enabled significant advancements in natural language processing, machine translation, and content generation.
And with the launch of GPT-4 on March 13, 2023, businesses now have access to even more advanced data analytics capabilities.
GPT-4 accepts text and image inputs, further expanding the potential for data-driven insights. Benefiting from GPT-4's capabilities, data analytics is just one of the many areas experiencing significant advancements.
As AI and machine learning technologies continue to evolve, we can expect more cutting-edge tools to emerge, providing businesses with unprecedented opportunities to harness the power of their data for better decision-making.
Steps forward
Keeping your money in your wallet and not putting it in your savings account stops you from earning interest. Similarly, unprocessed data in a spreadsheet will prevent you from reaping the benefits of better decision-making and increased inefficiencies.
With a plethora of data analytics tools available on the market, it's high time to start processing your data constructively. But knowing which data analytics tools your business needs is only the first step.
Rapidops is a trusted data analytics partner that has helped some of the industry's top companies identify, launch, and scale the tools they need to meet mission-critical goals and thrive in a digital world. Let us do the same for you! Contact us today to learn more.

What’s Inside
- The (r)evolution of data storing and processing
- The 1970s-1980s: The birth of spreadsheets
- The 1990s: Database management systems and BI tools
- In a nutshell: Microsoft Power BI vs. Tableau vs. QlikView vs. SAP BusinessObjects vs. IBM Cognos Analytics
- Difference: RapidMiner vs. IBM SPSS Modeler vs. KNIME vs. SAS Enterprise Miner vs. Oracle Data Mining
- The 2000s: Big Data and advanced analytics
- Divergence: Microsoft Azure ML vs. Google Cloud AutoML vs. DataRobot vs. H2O.ai vs. Alteryx
- Face-off: Dundas BI vs. Sisense vs. Looker vs. TIBCO Spotfire vs. Domo Dundas BI
- The 2010s: The AI revolution and cloud-based analytics
- The 2020s: Continued innovation and specialized analytics tools
- Present and Beyond: The integration of GPT and AI-powered data analysis
- Steps forward

Let’s build the next big thing!
Share your ideas and vision with us to explore your digital opportunities
Similar Stories
- Analytics
- undefined Mins
- July 2019


Receive articles like this in your mailbox
Sign up to get weekly insights & inspiration in your inbox.