

Does your data have a purpose? If not, you're spinning your wheels for all the wrong causes.
In today's digital landscape, data is the lifeblood of any successful business looking to discover that purpose and turn it into action. This data analytics guide will help you do just that by exploring the importance of data analytics for driving business growth and how Rapidops can help you unlock your organization's full potential with cutting-edge data analytics solutions. Let's get started.
How can data analytics transform businesses and drive growth?
There has been a swift expansion of digital technologies. Coupled with the exponential data growth, this has introduced the business community to an era where the power of harnessing data and converting it into actionable insights acts as a key differentiator to gaining a competitive edge, enhancing operational efficiency, and driving organizational growth.
Data analytics has an immense transformative impact on various business dimensions, such as:
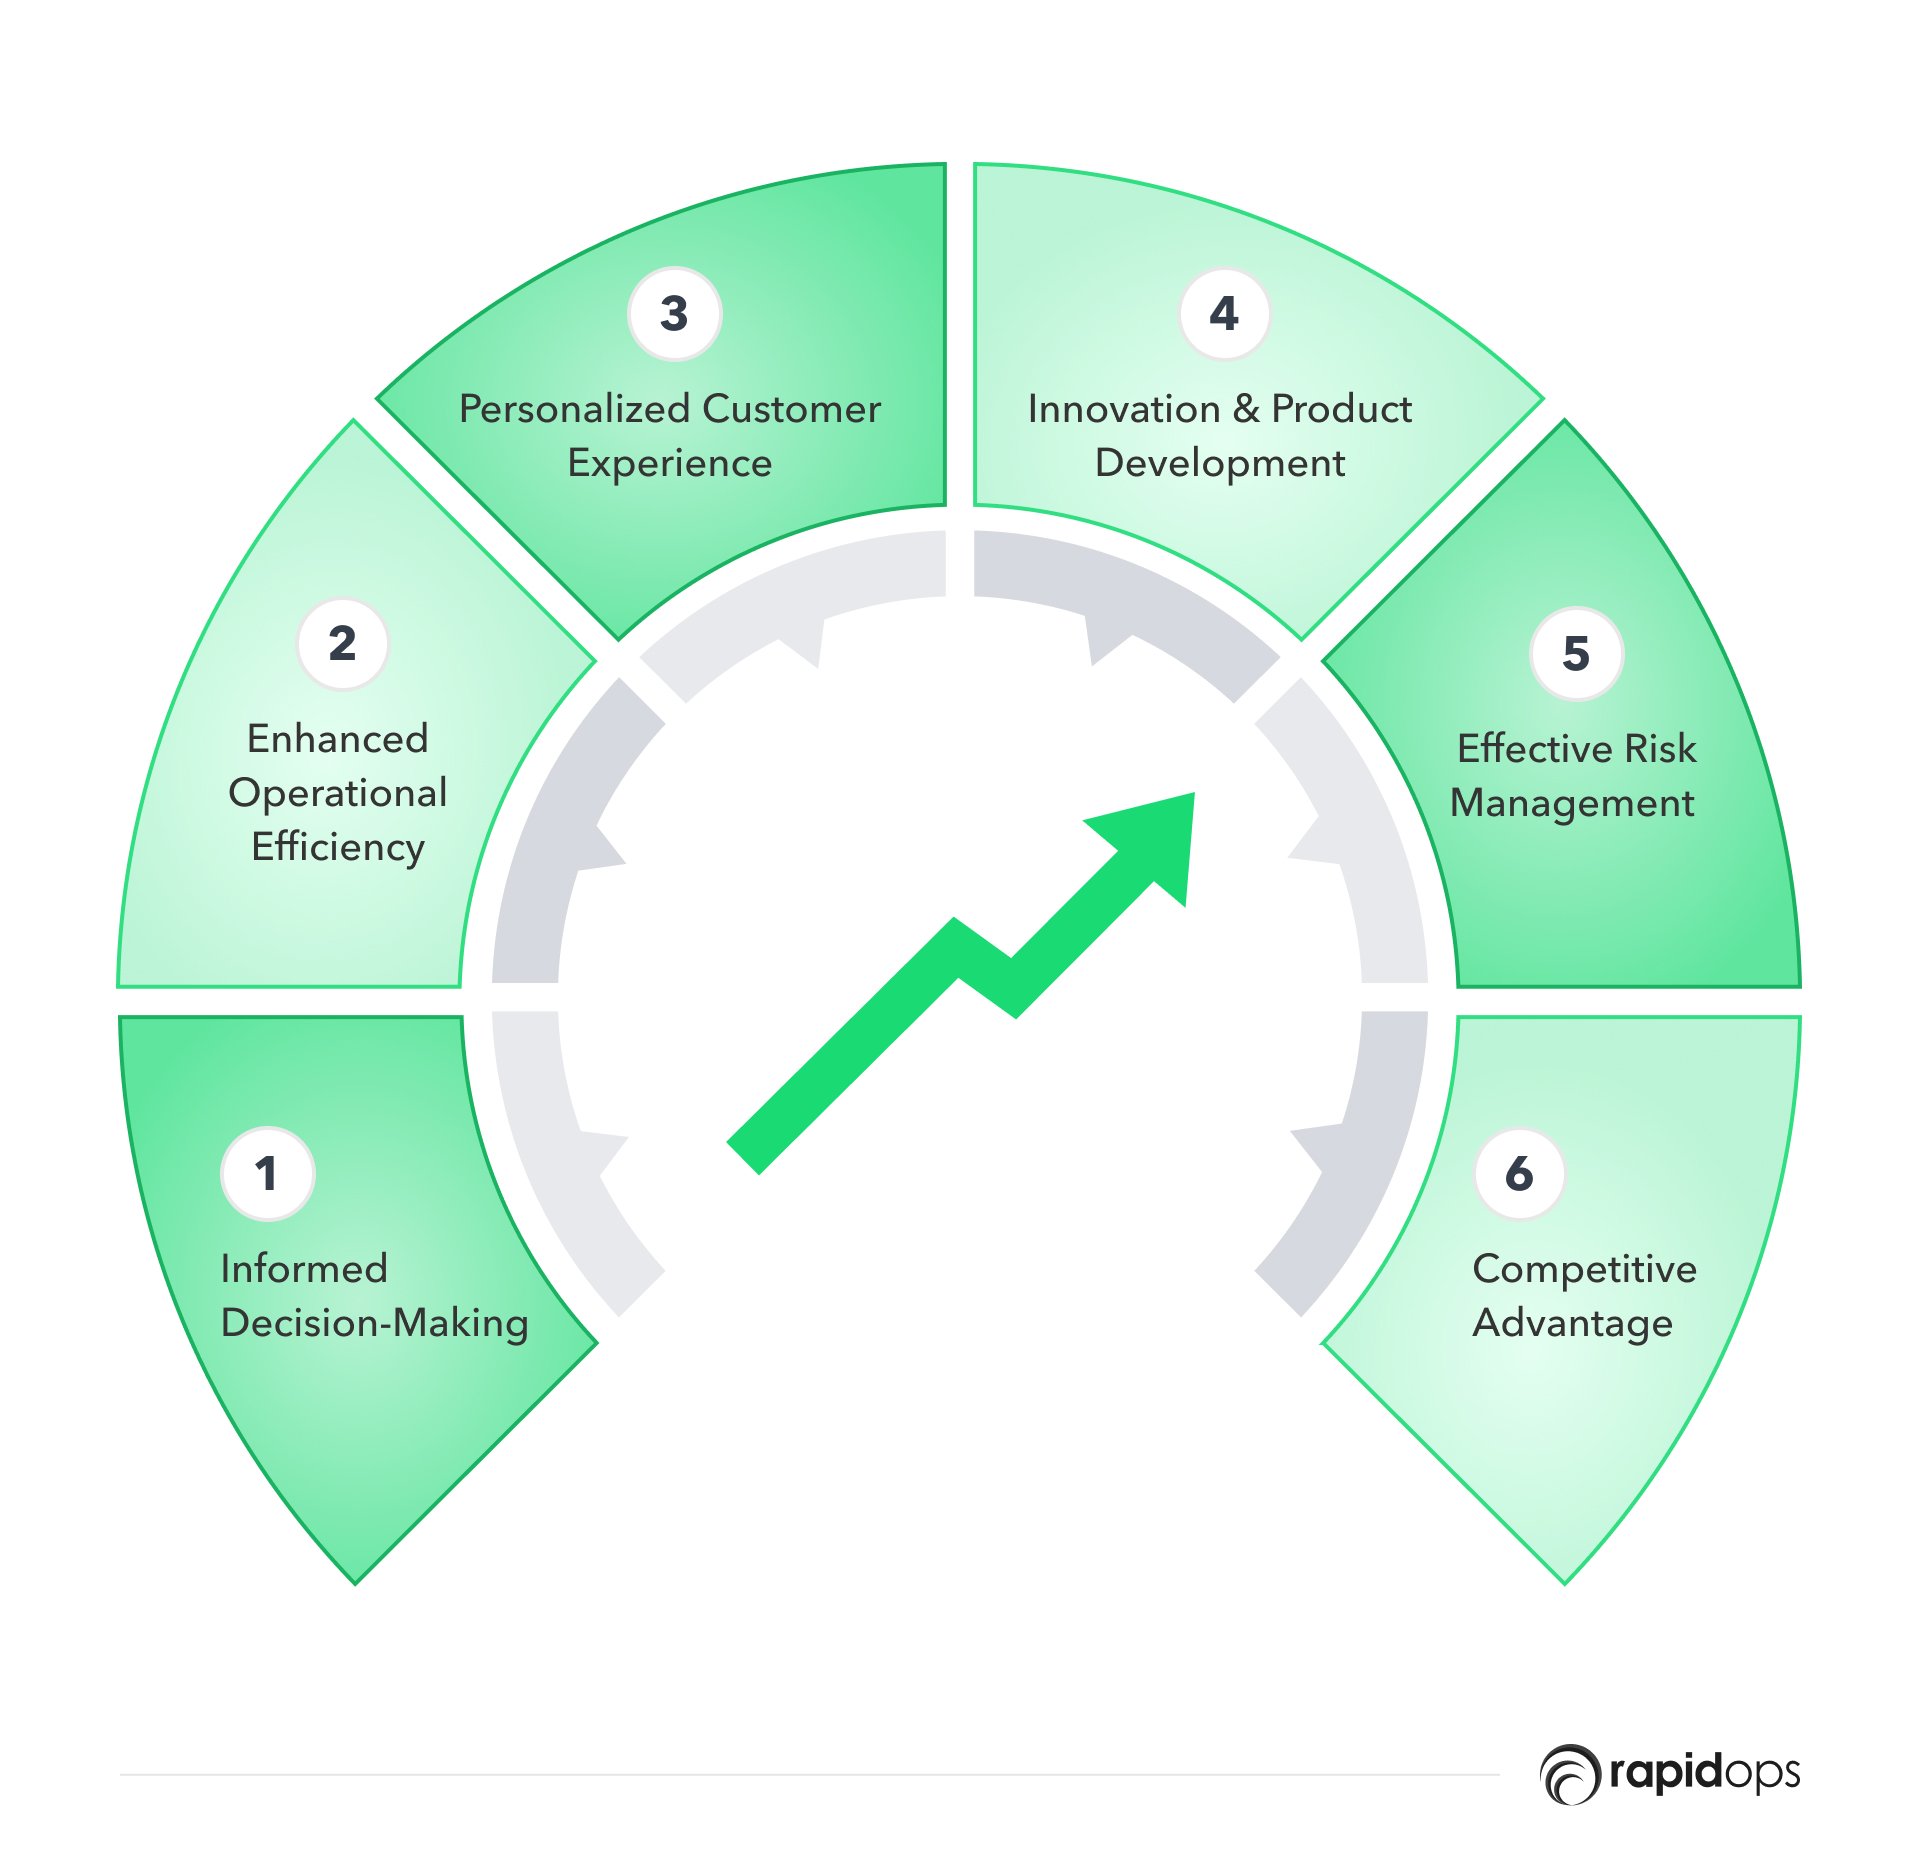
1. Informed decision-making
Data analytics allows businesses to make data-driven decisions by eliminating guesswork and intuition-based decision-making. Businesses can leverage insights derived from the analysis of historical data to identify trends, monitor performance, and anticipate market shifts, enabling them to make proactive and well-informed decisions.
2. Enhanced operational efficiency
By analyzing its operational data, businesses can identify bottlenecks, inefficiencies, and areas for improvement in their processes. By taking appropriate countermeasures for these inefficiencies, businesses can boost their productivity, cut down on unnecessary, miscellaneous costs, and ultimately boost their bottom line.
3. Personalized customer experience
Data analytics enables businesses to understand customers' needs, preferences, and behaviors, allowing them to tailor offerings, marketing campaigns, and communications to improve engagement, loyalty, and satisfaction. These insights can also power automated advertising through a programmatic advertising platform, enabling precise targeting, real-time optimization, and higher ROI through data-driven decision-making.
4. Innovation and product development
Data analytics can help businesses identify market gaps, emerging trends, and customer pain points, facilitating the development of innovative products and services that cater to evolving customer needs and drive its business growth.
5. Effective risk management
Data analytics can identify patterns and correlations in data, helping businesses anticipate and mitigate potential risks such as operational challenges or market fluctuation.
6. Competitive advantage
Companies that effectively leverage data analytics to implement effective risk management strategies gain a better competitive edge in the market by capitalizing on growth opportunities, optimizing operations, and making informed decisions faster than their competitors.
A typical data analytics process
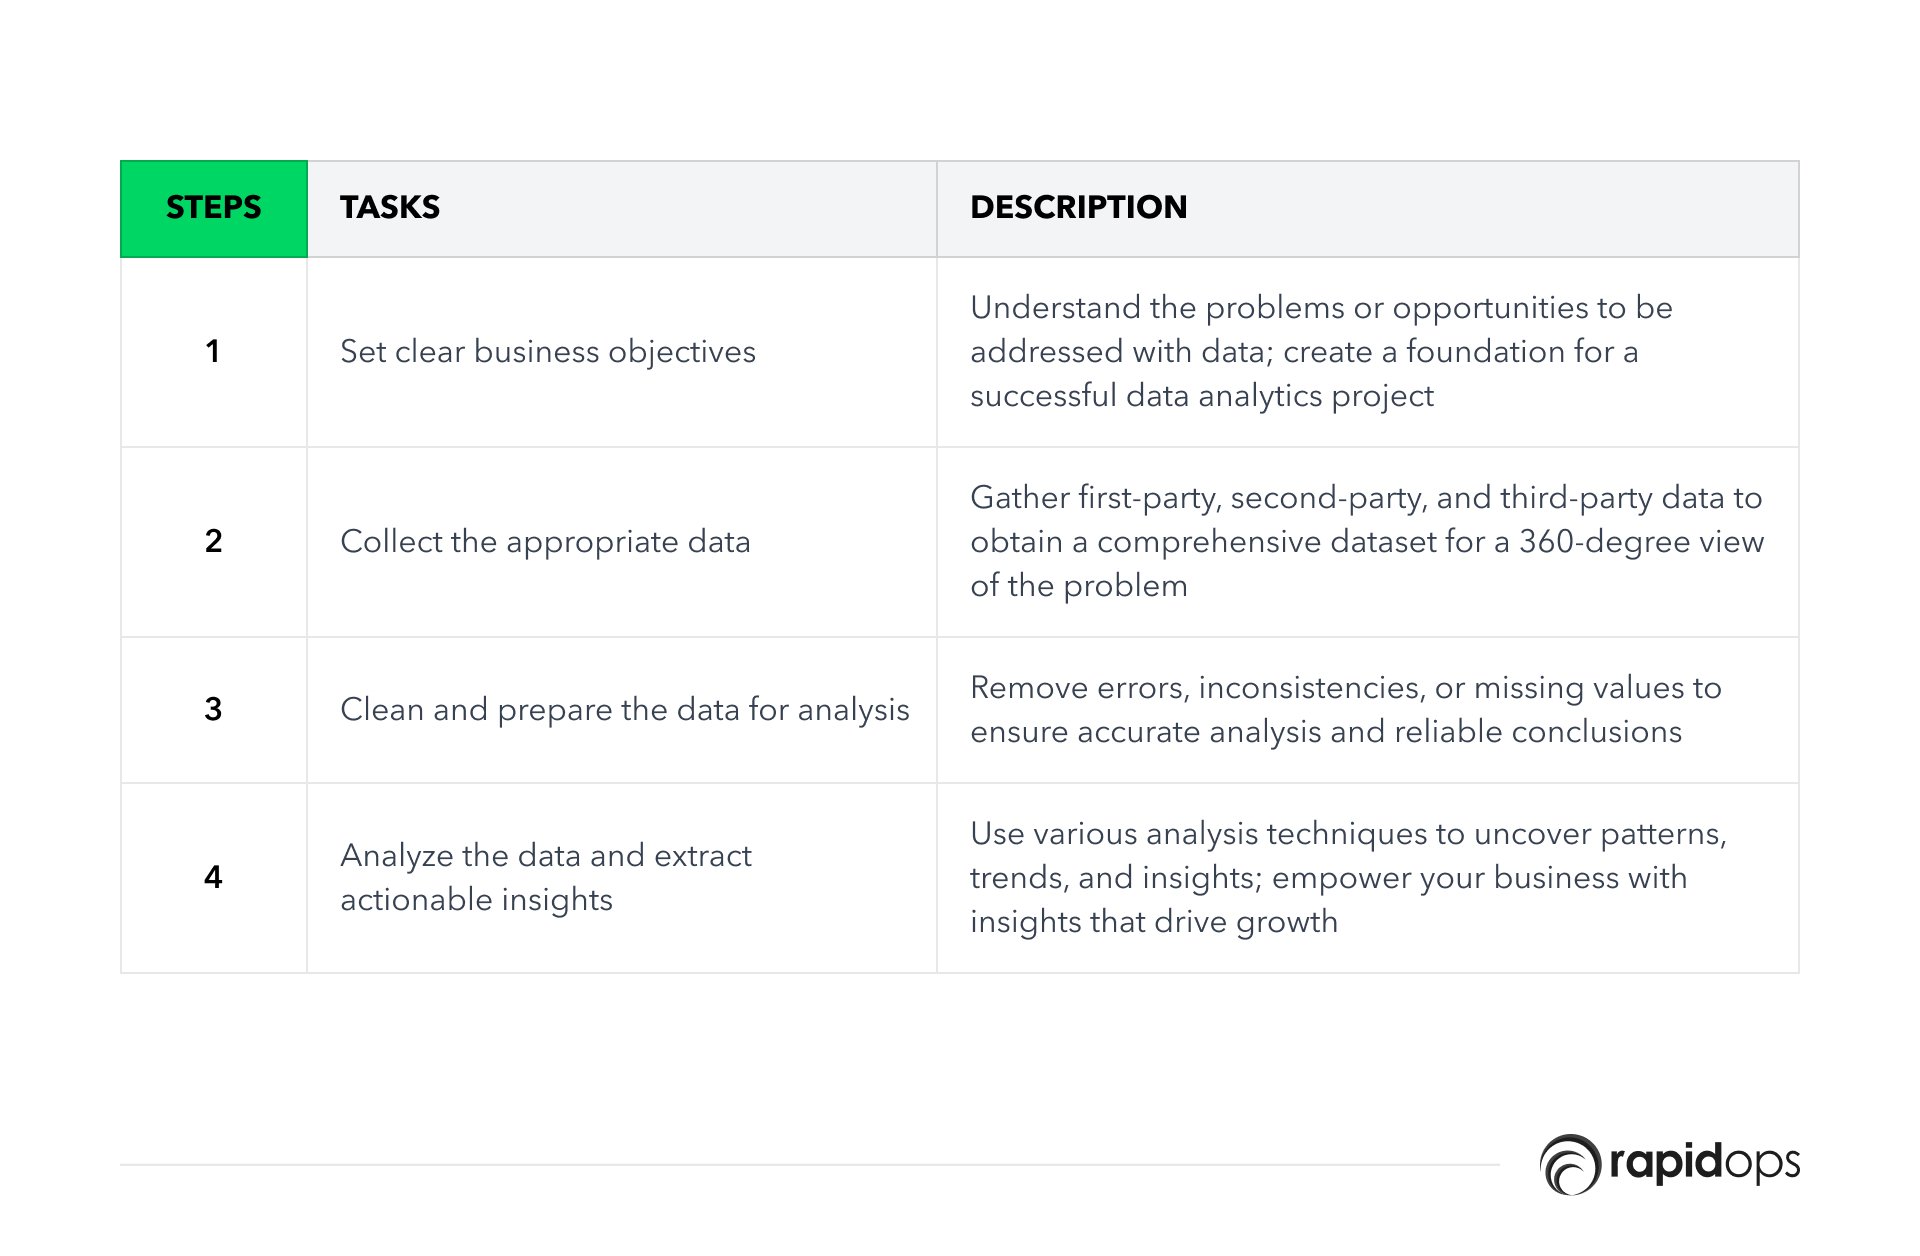
1. Define your business objectives and collect relevant data
As a business owner, embarking on a data analytics journey begins by clearly understanding the business problems you want to address or the opportunities you want to uncover.
Start by identifying the specific issues or questions that data can help you answer. For example, an e-commerce store owner might want to find ways to increase customer retention or a manufacturing company may want to streamline its production process.
Establishing well-defined objectives will set the foundation for a successful data analytics project that aligns with your business goals.
2. Collect the right data
Once you clearly understand your objectives, it's time to gather the data that will help you achieve them. There are three main types of data you can use:
First-party data
This is data collected directly from your customers, such as purchase information, customer surveys, or in-store interactions. This data helps you better understand and engage with your customers and tailor your offerings to their preferences.
Second-party data
This is first-party data shared with you by a trusted partner or company. This data type can provide additional insights about your customers, uncover trends, and help you forecast growth.
Third-party data
This is data collected by organizations or entities that don't have a direct relationship with the individuals they're gathering information from. Examples include open data repositories or government resources. Third-party data can provide valuable context and enrich your existing datasets.
This step aims to collect a comprehensive dataset that provides a 360-degree view of the problem you want to solve.
3. Clean and prepare your data
After gathering your data, cleaning and preparing it for analysis is essential. This process removes errors, inconsistencies, or missing values that could skew your results. Data cleaning ensures the accuracy of your analysis and helps you draw reliable conclusions from your data.
4. Analyze the data and extract insights
With your data cleaned and prepared, you can dive into the analysis. Employ various data analysis techniques and marketing agency report templates to uncover patterns, trends, and insights to help you make informed decisions.
For example, a retailer might use customer segmentation to tailor marketing campaigns, or a logistics company might analyze delivery data to optimize routes and reduce costs.
Remember, the ultimate goal of your data analytics project is to empower your business with actionable insights that drive growth and success.
Challenges of implementing data analytics in an organization
Analytics will define the difference between the losers and winners going forward - Tim McGuire, Director, McKinsey
Implementing data analytics in an organization comes with its own set of challenges. Here are some common obstacles organizations face, accompanied by instances to help illustrate these issues:
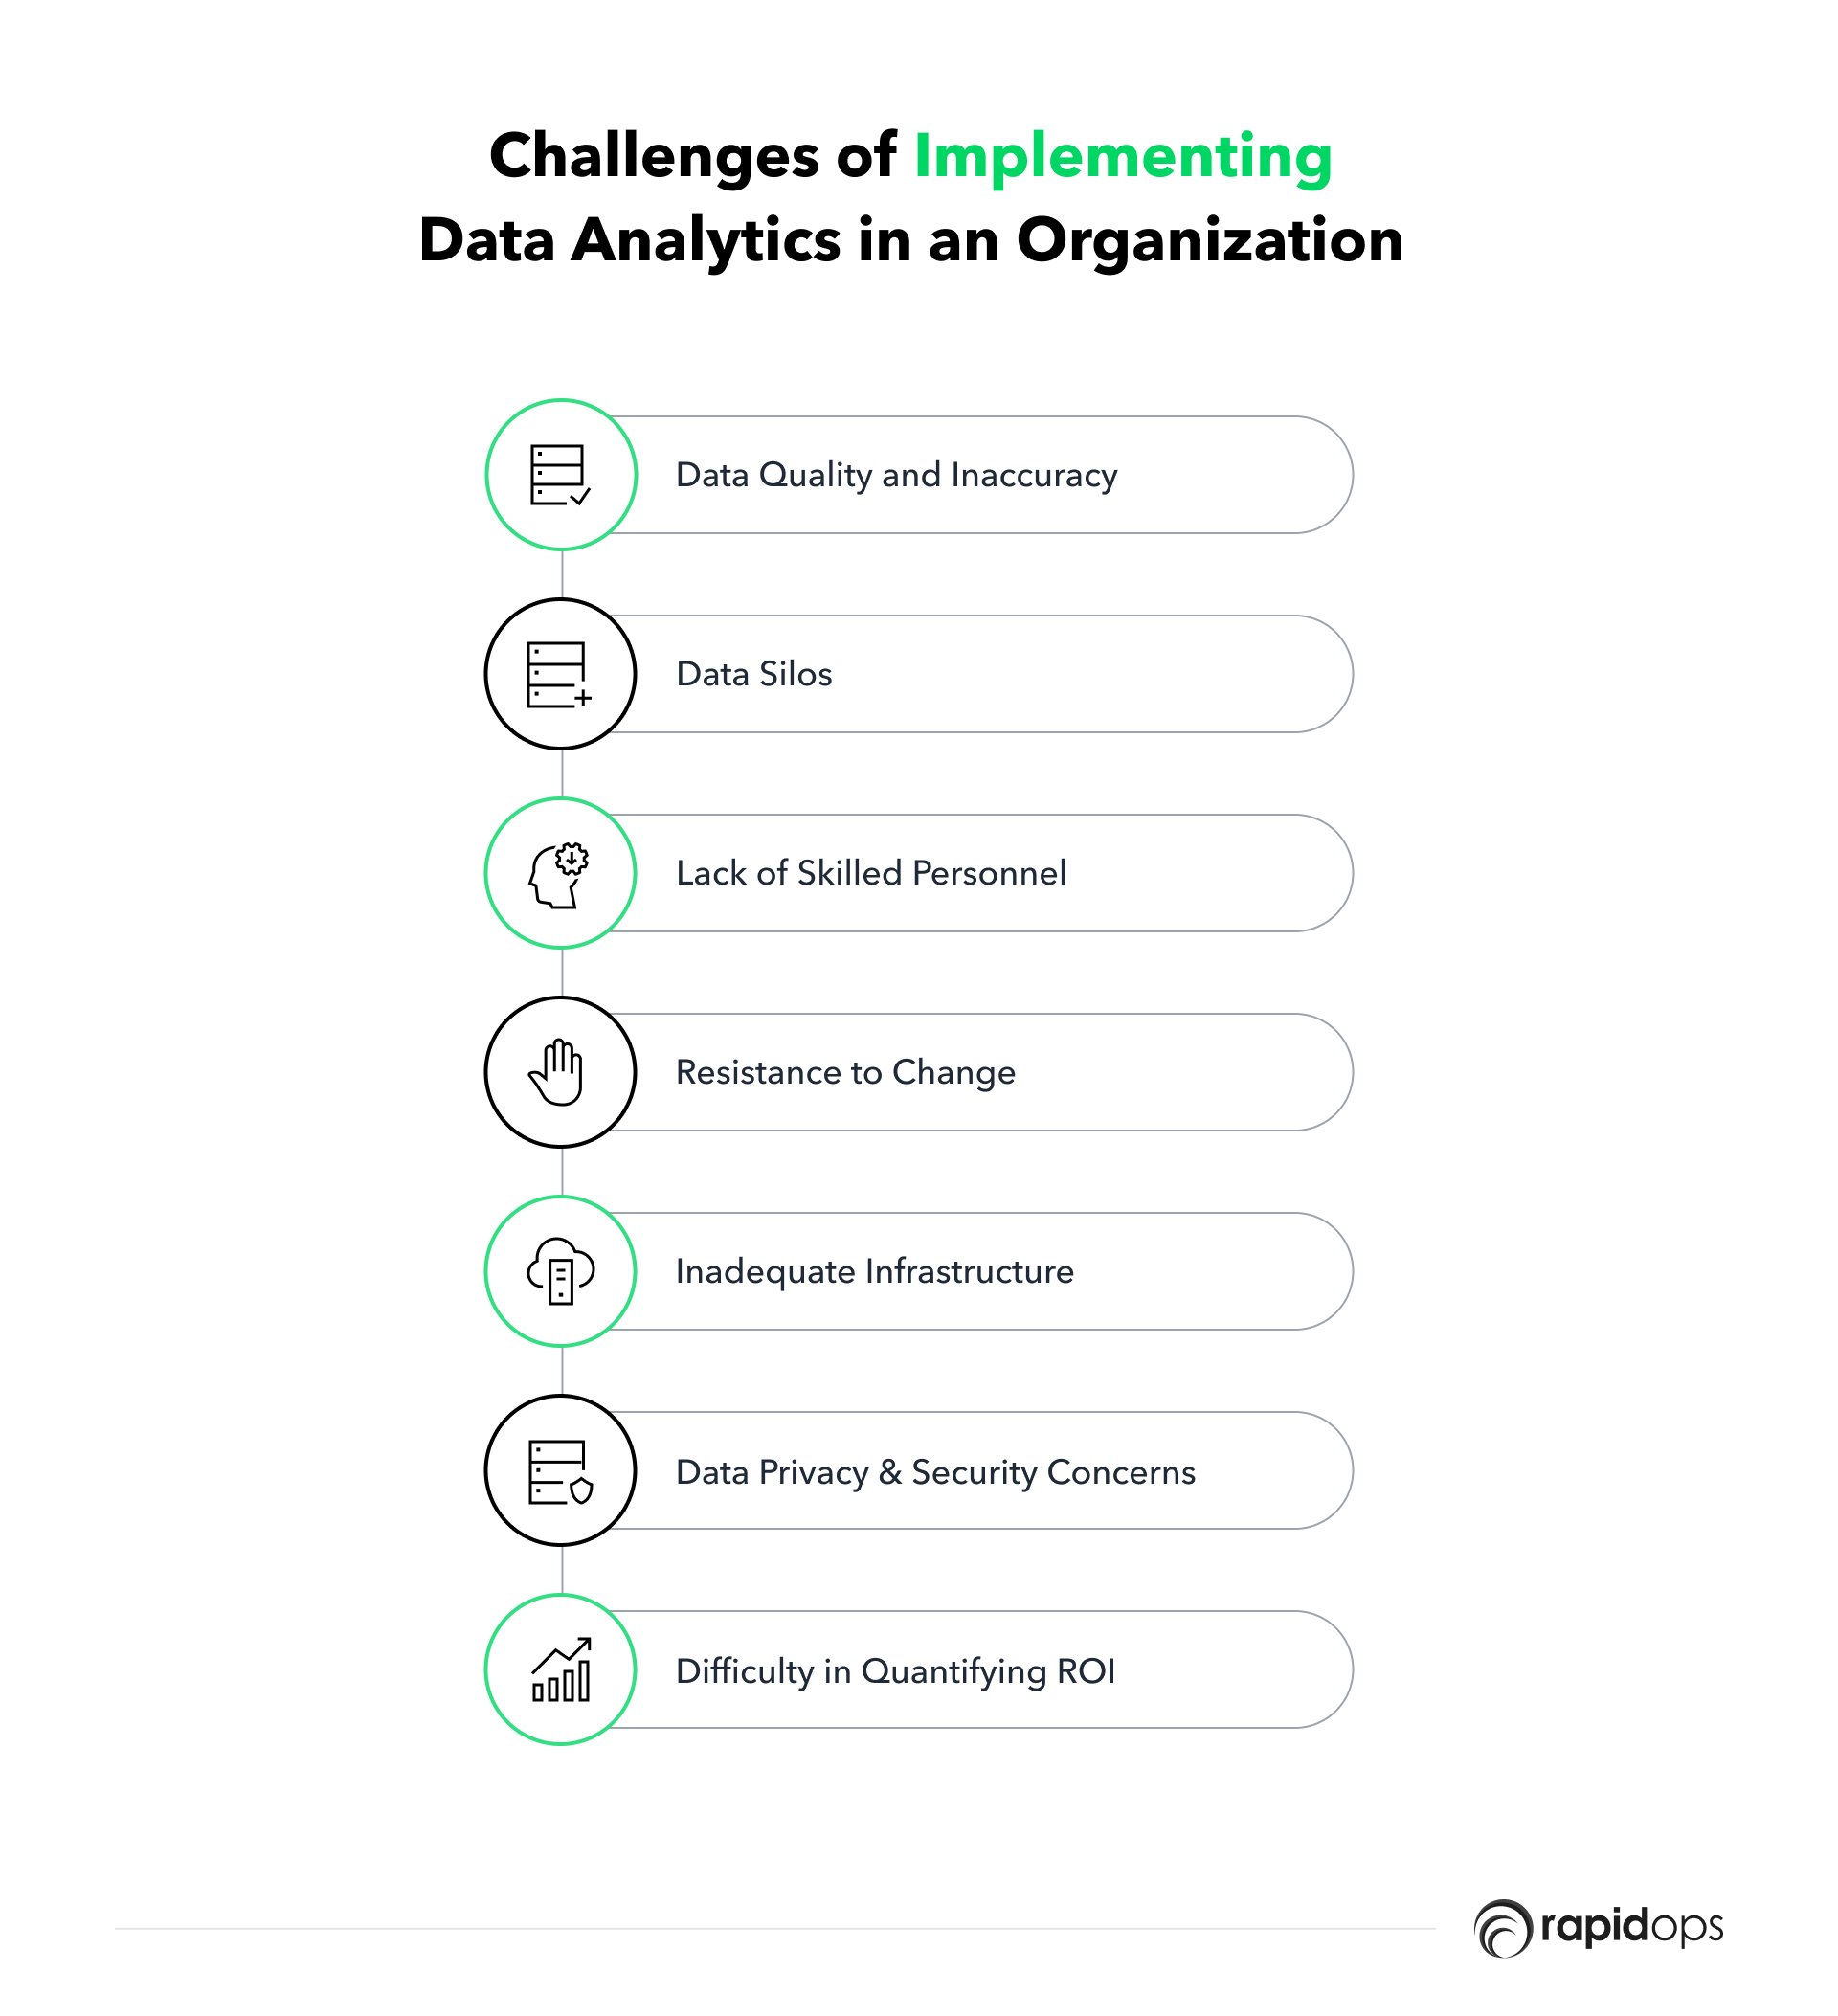
1. Data quality and inaccuracy
Ensuring data accuracy is crucial for effective analytics. However, organizations often struggle with inconsistencies, missing values, or outdated information.
For instance, a retail company with inaccurate inventory data could misjudge consumer demand patterns, leading to poor stock management and lost sales opportunities.
Tips for overcoming data quality and inaccuracy challenges:
- Implement data validation checks and data cleaning processes
- Regularly audit and update the data to maintain accuracy
- Establish data governance policies and assign responsibility for data quality management
2. Data silos
Many organizations store data in separate systems, hindering their ability to combine and analyze the information comprehensively.
For example, a healthcare provider might have patient data spread across various departments, making it challenging to gain a holistic view of patient health and develop personalized treatment plans.
Tips for overcoming siloed data challenge:
- Integrate data systems and databases to create a unified data repository
- Adopt a data lake or data warehouse architecture to centralize and organize data
- Encourage cross-functional collaboration and data sharing among departments
3. Lack of skilled personnel
A shortage of data analytics professionals can hinder an organization's ability to leverage data effectively.
A small manufacturing firm may lack the in-house expertise to analyze production data, potentially overlooking inefficiencies or opportunities for process improvement.
Tips for overcoming the lack of skilled personnel challenge:
- Invest in training and upskilling existing employees in data analytics
- Hire qualified data analysts or partner with data analytics service providers
- Promote a data-driven culture to attract skilled professionals
4. Resistance to change
The adoption of data analytics may face resistance from employees who are unfamiliar or uncomfortable with new technology. For instance, a sales team might be reluctant to adopt a data-driven sales strategy, fearing it will undermine their traditional approach and experience.
Tips for overcoming the resistance challenge:
- Communicate the benefits of data analytics clearly to employees
- Provide training and support to help employees adapt to new technologies and processes
- Involve employees in the implementation process and encourage their input
5. Inadequate infrastructure
Organizations may lack the necessary hardware and software to support their data analytics efforts.
A startup trying to analyze social media data to understand customer sentiment could struggle if its infrastructure cannot handle the volume and variety of data generated by social media platforms.
Tips for overcoming infrastructure challenge:
- Invest in upgrading hardware and software to support data analytics initiatives
- Consider using cloud-based solutions to scale infrastructure as needed
- Collaborate with IT experts to ensure a robust and reliable infrastructure setup
6. Data privacy and security concerns
Ensuring data privacy and security is a significant challenge in today's digital landscape.
A financial institution aiming to use customer transaction data for analytics must balance the insights gained with the need to protect sensitive information and comply with data protection regulations.
Tips for overcoming privacy and security challenge:
- Establish strict data security and privacy policies
- Implement encryption, access controls, and regular security audits
- Stay up to date with data protection regulations and best practices
7. Difficulty in quantifying ROI
Measuring data analytics initiatives' return on investment (ROI) can be challenging, as the benefits may be intangible or only become apparent over time.
A logistics company implementing data analytics to optimize delivery routes might not see immediate cost savings. Still, the cumulative impact on efficiency and fuel consumption could be substantial in the long run.
Tips for overcoming the ROI quantification challenge:
- Establish clear objectives and performance metrics for data analytics projects
- Continuously monitor and evaluate the impact of analytics initiatives on business outcomes
- Be patient and recognize that the benefits of data analytics may accumulate over time
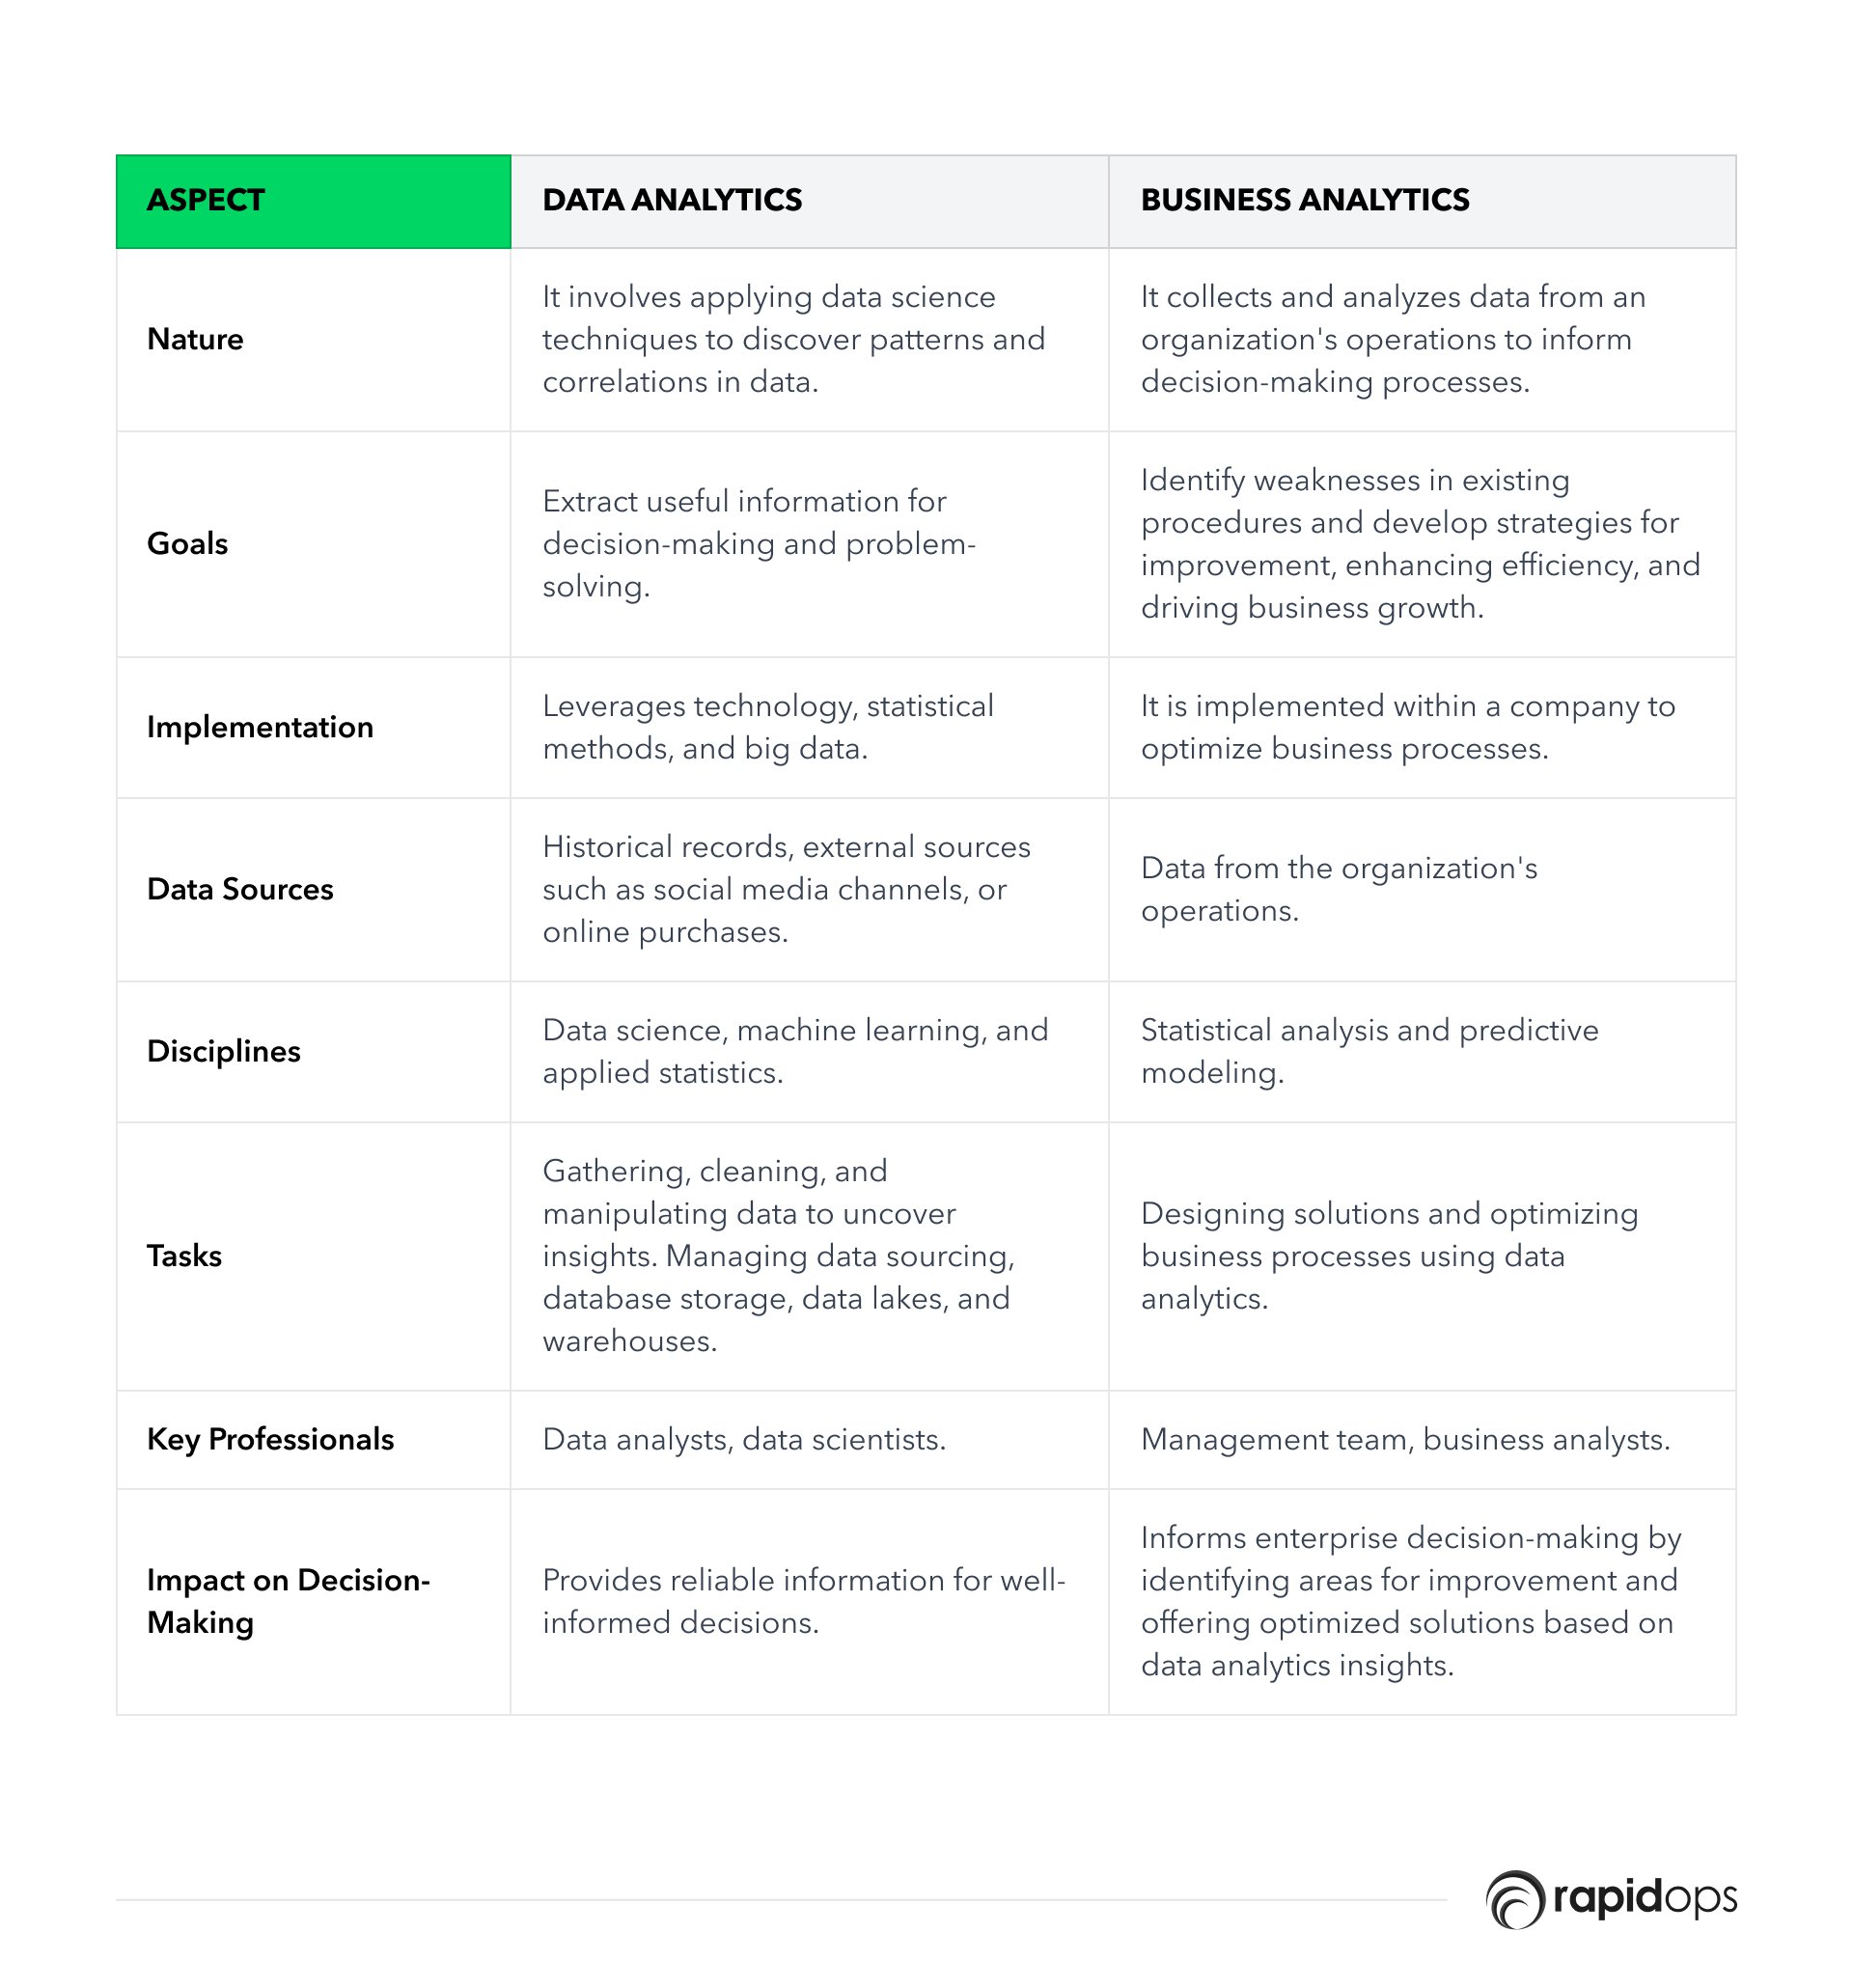
Business analytics vs. data analytics: An in-depth comparison
Businesses must understand the distinct roles that data analytics and business analytics play.
While these two disciplines share similarities and often complement each other, they serve different purposes within an organization's data strategy.
In this section, we'll explore the key differences between data analytics and business analytics, shedding light on their unique focuses, data management approaches, data modeling techniques, and the importance of data quality.
While business and data analytics might appear synonymous and often interchangeable, they are distinct in nature and application.
Both disciplines share some common goals and statistical techniques but serve unique roles in a business context.
Data analytics involves applying data science techniques to discover patterns and correlations in business-related data. It leverages technology, statistical methods, and big data to extract useful information for decision-making and problem-solving.
Data analytics enables organizations to make well-informed decisions based on reliable information from their historical records or external sources such as social media channels or online purchases.
On the other hand, business analytics involves collecting and analyzing data from an organization's operations to inform decision-making processes.
It is implemented within a company to identify weaknesses in its existing procedures and develop strategies for improvement, ultimately enhancing efficiency and driving business growth.
Data analytics involves gathering, cleaning, and manipulating data to uncover insights that inform business decisions. Data analysts manage data sourcing, database storage, data lakes, and data warehouses and organize them for exploratory analysis.
Disciplines within data analytics include data science, machine learning, and applied statistics.
Conversely, business analytics focuses on designing solutions and optimizing business processes through data analytics, statistical analysis, and predictive modeling.
While data scientists and analysts conduct data analytics, business analytics primarily falls within the domain of the management team as it pertains to enterprise decision-making.
We can further explore the key differences between business analytics and data analytics in these key areas:
1. Focus
Data analytics centers around collecting and manipulating business data through SQL querying and programming code to reveal functional and previously unknown correlations.
On the other hand, business analytics identifies data trends and patterns and correlates them with proprietary BI information to unveil meaningful insights.
2. Data management
Data management encompasses the design and maintenance of an organization's data architecture. Data scientists design modeling workflows to handle complex data sets and identify trends and patterns that inform intelligent business decisions.
In contrast, business analytics involves comparing structured and visualized data, leveraging it for benchmarking and predictive modeling.
3. Data modeling
Data modeling offers insights into future trends, allowing businesses to answer questions about past events, likely future events, and potential actions.
Data modeling serves data and business analytics, providing a way to view probable future data trends and predict outcomes by analyzing KPI metrics.
4. Data quality
Data analytics provides data open to interpretation, with numerous probabilities and theoretical possibilities. It does not offer a business solution or consolidated data insights.
The actual study of data for innovation and problem-solving occurs when business analysts compile and analyze the information to present a coherent version of the truth to stakeholders.
A basic understanding of data analytics types
Data analytics helps businesses examine, clean, transform, and model the collected data to extract valuable insights and have improved decision-making capabilities.
As organizations generate and collect vast amounts of data from various sources, such as customer interactions, social media, and IoT devices, developing an effective data analytics process becomes a critical strategic asset that enables businesses to gain a competitive edge.
It is crucial in helping businesses understand their customers, optimize operations and drive revenue growth.
The four primary data analytics types:
1. Descriptive analytics
It focuses on summarizing past data to identify patterns and trends. It helps businesses understand what has happened in the past and provides a foundation for more advanced analytics.
2. Diagnostic analytics
Diagnostic analytics digs deeper into data to determine the root causes of past events. It enables organizations to identify patterns and correlations, uncovering the reasons behind successes or failures.
3. Predictive analytics
Predictive analytics uses historical data and statistical algorithms to forecast future events. It allows businesses to anticipate customer behavior, market trends, and potential risks, helping them make informed decisions.
4. Prescriptive analytics
Prescriptive analytics goes beyond predicting future outcomes by offering recommendations on the best action to achieve specific goals. It enables organizations to optimize their strategies and resources for maximum impact.
The data analytics process typically involves data collection, data preprocessing, data analysis, and data visualization. Each stage is crucial in ensuring businesses extract valuable insights from their data.
The evolution of analytics
1. Ancient Egypt (circa 2700-2200 BCE)
Data analytics in its infancy
Egyptians utilized early forms of data analytics to plan and construct the iconic pyramids, demonstrating the practical applications of analytics even thousands of years ago.
2. 19th Century
The dawn of modern analytics
Frederick Taylor pioneered time management exercises, while Henry Ford optimized his assembly lines through data-driven tracking, setting the stage for the essential role analytics would come to play in business.
3. 1960s
Enter the computer age
With computers central to decision-making systems, data analytics became a more refined and sophisticated science, paving the way for groundbreaking advancements.
4. Late 20th Century
The power of computing
As powerful computing technology emerged, big data and data mining techniques developed, revolutionizing the analytics field and expanding its potential applications.
5. Early 21st Century
The data analytics revolution
New and exciting forms of data analytics emerged, such as predictive, cognitive, and prescriptive analytics, enabling businesses to extract more value from their data and make better-informed decisions.
6. Present Day
The age of augmented analytics
Advanced analytics techniques like augmented analytics continue to shape the landscape, helping businesses uncover hidden insights, streamline operations, and gain a competitive edge in an increasingly data-driven world.
Steps to implementing data analytics solutions
Are you drowning in a sea of data yet struggling to progress toward your business objectives? You're not the only one. Even well-established businesses can feel overwhelmed by the sheer volume of data they encounter.
Incorporating data analytics is crucial for propelling your business forward, but it can be challenging to determine where to begin. That's why we've crafted this roadmap for organizations embarking on their data analytics journey.
This analytics implementation section will introduce you to the essentials of data analytics and equip you with valuable tips, recommendations, and resources to kick-start your journey. Implementing data analytics in your organization involves several key steps.
A well-planned roadmap ensures you effectively leverage data to make informed decisions, optimize operations, and gain a competitive edge. Here are the essential steps for implementing data analytics:
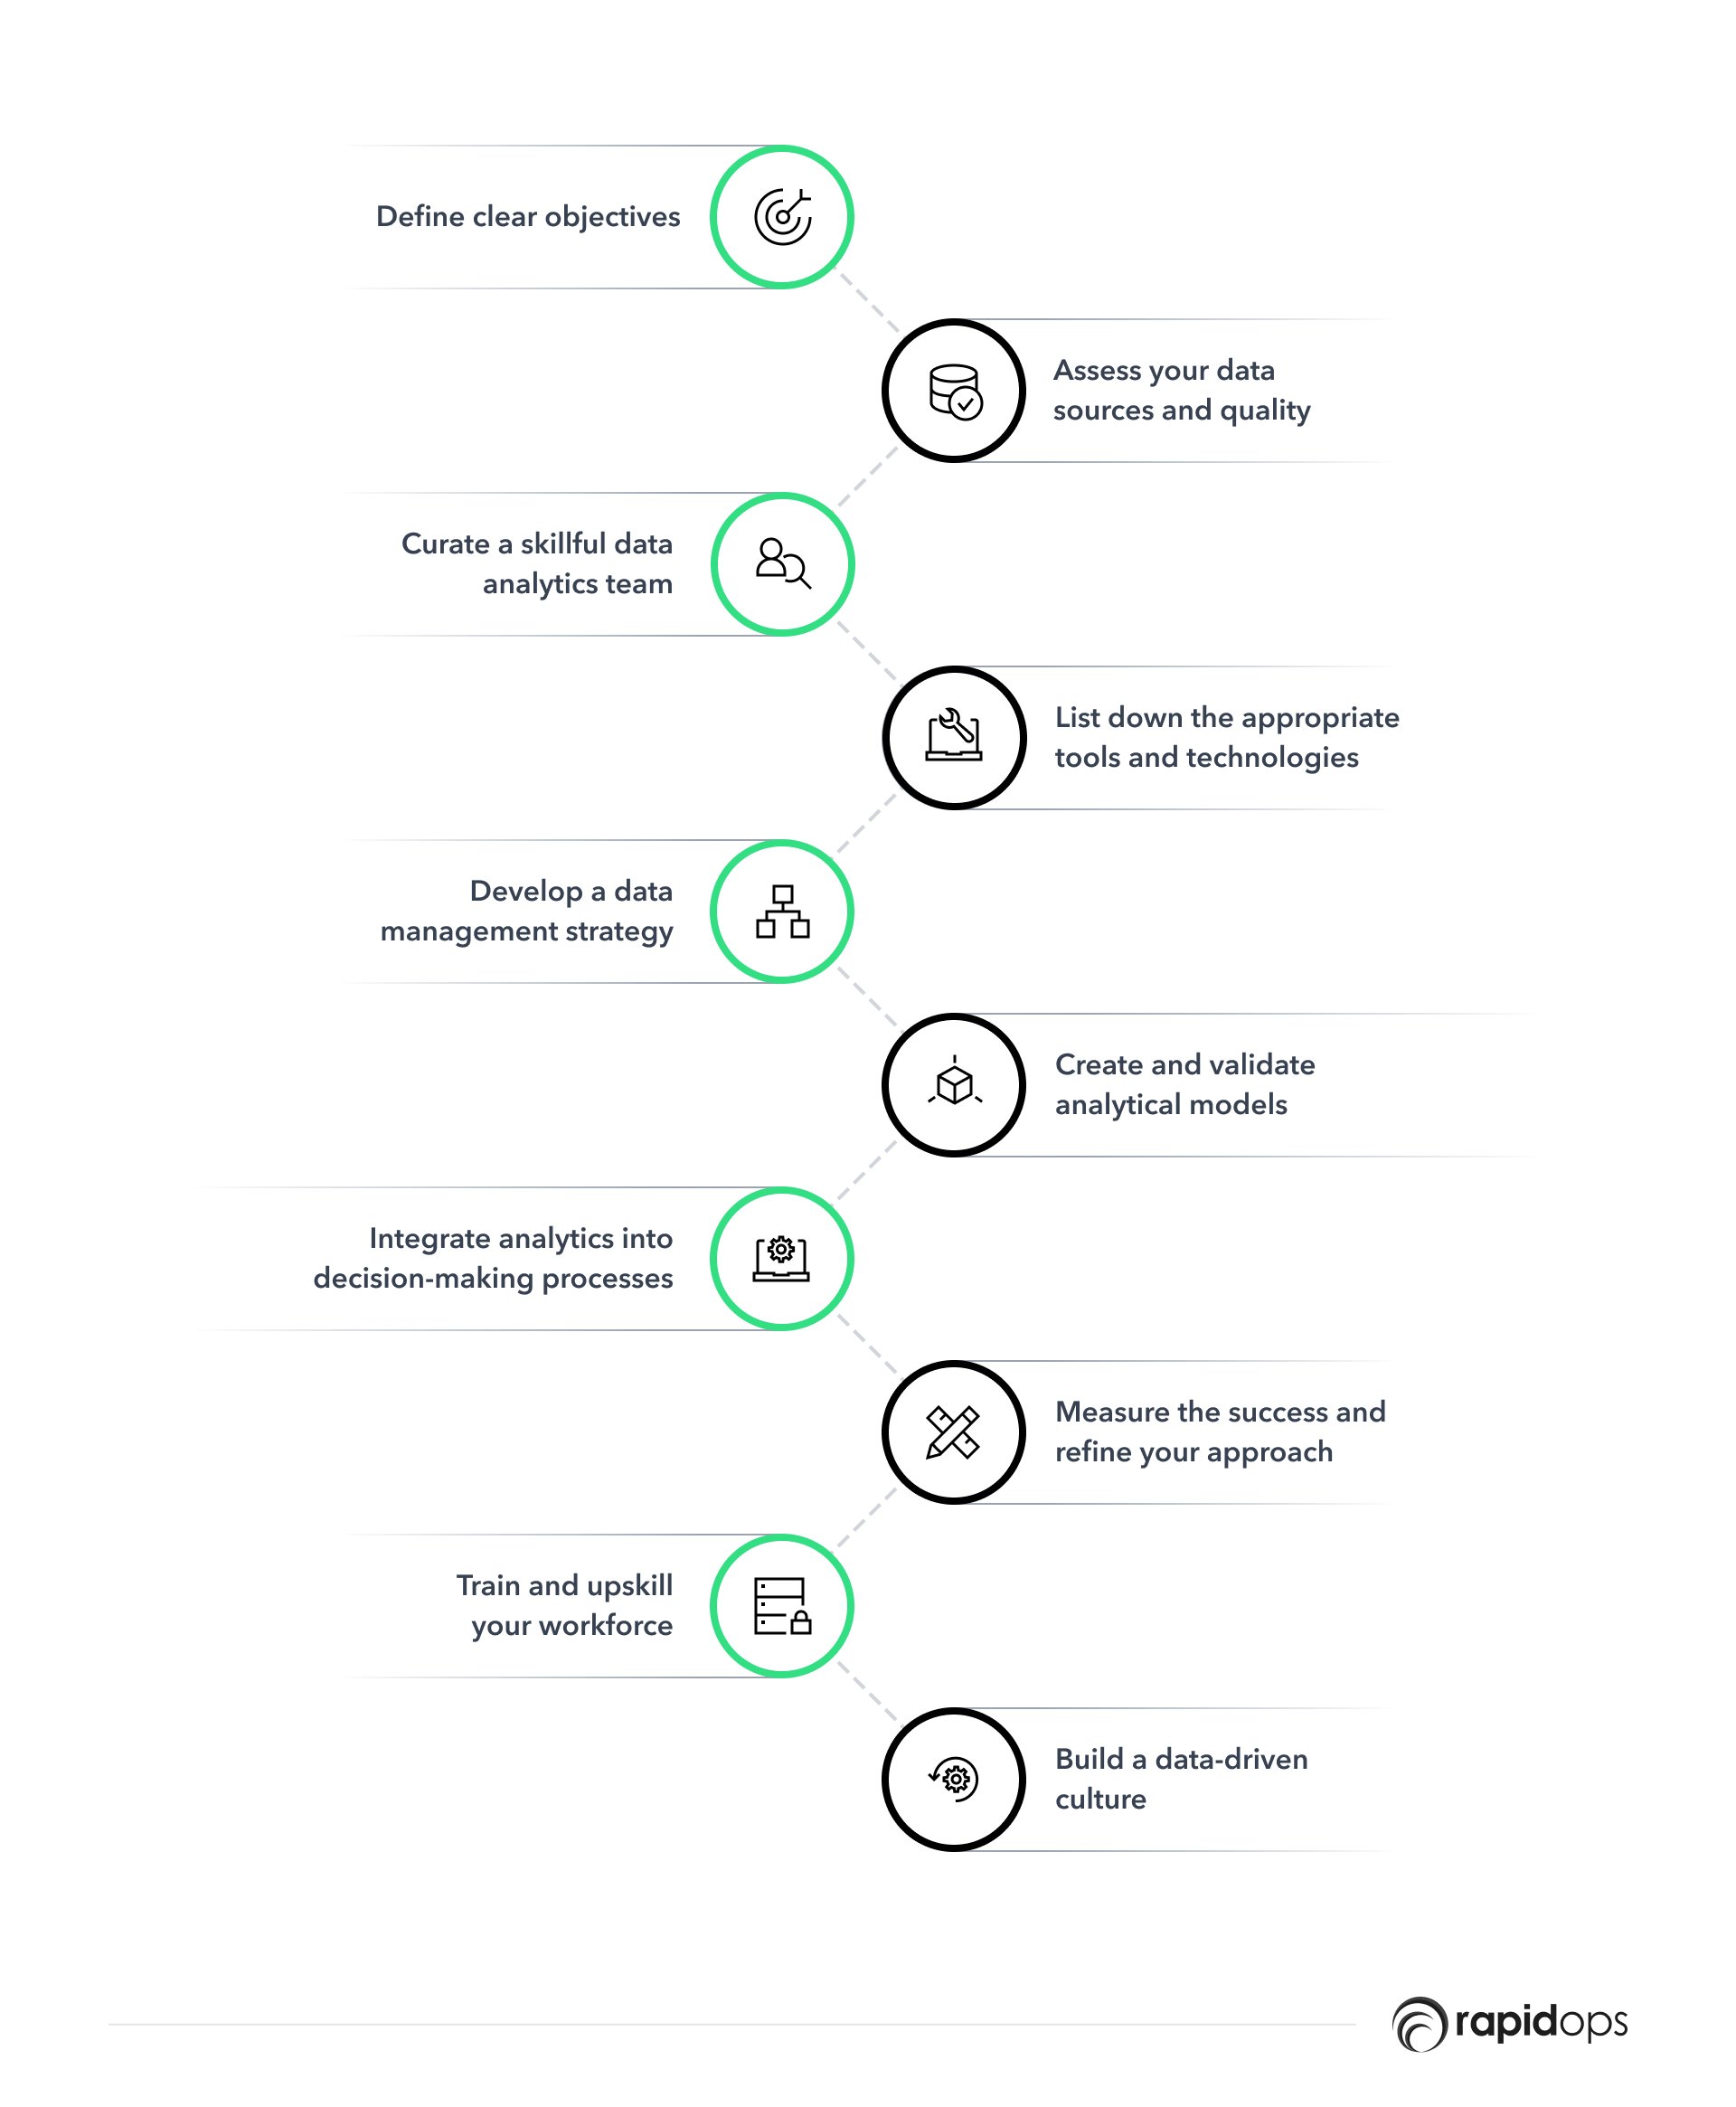
1. Define clear objectives for your data analytics initiative
Identify the specific goals and objectives you want to achieve with data analytics. This could include improving operational efficiency, increasing customer satisfaction, or gaining insights into market trends.
2. Assess your data sources and quality
Evaluate your existing data sources, including internal and external data, and determine their quality and relevance to your objectives. Identify any gaps in your data and address them by collecting or integrating additional data as needed.
3. Curate a skillful data analytics team
Put together a team of professionals with the right mix of skills, including data scientists, analysts, engineers, and domain experts who understand your industry and business context.
4. List down the appropriate tools and technologies
Select the data analytics tools and technologies that best align with your objectives, available resources, and team's skillset. Consider data storage, processing, analysis, visualization, and reporting tools.
5. Develop a data management strategy
Create a data management strategy that covers data collection, storage, processing, governance, and security. This ensures the quality, consistency, and accessibility of your data while complying with relevant regulations and protecting your organization's sensitive information.
6. Create and validate analytical models
Develop analytical models tailored to your objectives using machine learning, statistical analysis, or predictive modeling. Validate the accuracy and effectiveness of these models using historical data or test scenarios.
7. Integrate analytics into your organization's decision-making processes
Embed the insights derived from your data analytics into your organization's decision-making processes. Ensure relevant stakeholders can access the insights and understand how to interpret and act on them.
8. Measure the success and refine your approach
Regularly assess the impact of your data analytics efforts on your organization's performance using key performance indicators (KPIs) and other metrics. Use these insights to refine your approach, improve your models, and optimize your data analytics strategy.
9. Train and upskill your workforce
As your data analytics initiatives evolve, investing in ongoing training and upskilling programs for your team is essential. This ensures they stay current with the latest tools, techniques, and industry best practices.
10. Build a data-driven culture
Organizations should foster a data-driven culture encouraging experimentation, learning, and adaptation to facilitate continuous improvement. This can involve providing training and resources to employees, promoting cross-functional collaboration, and celebrating data-driven successes.
A data analytics framework for business owners
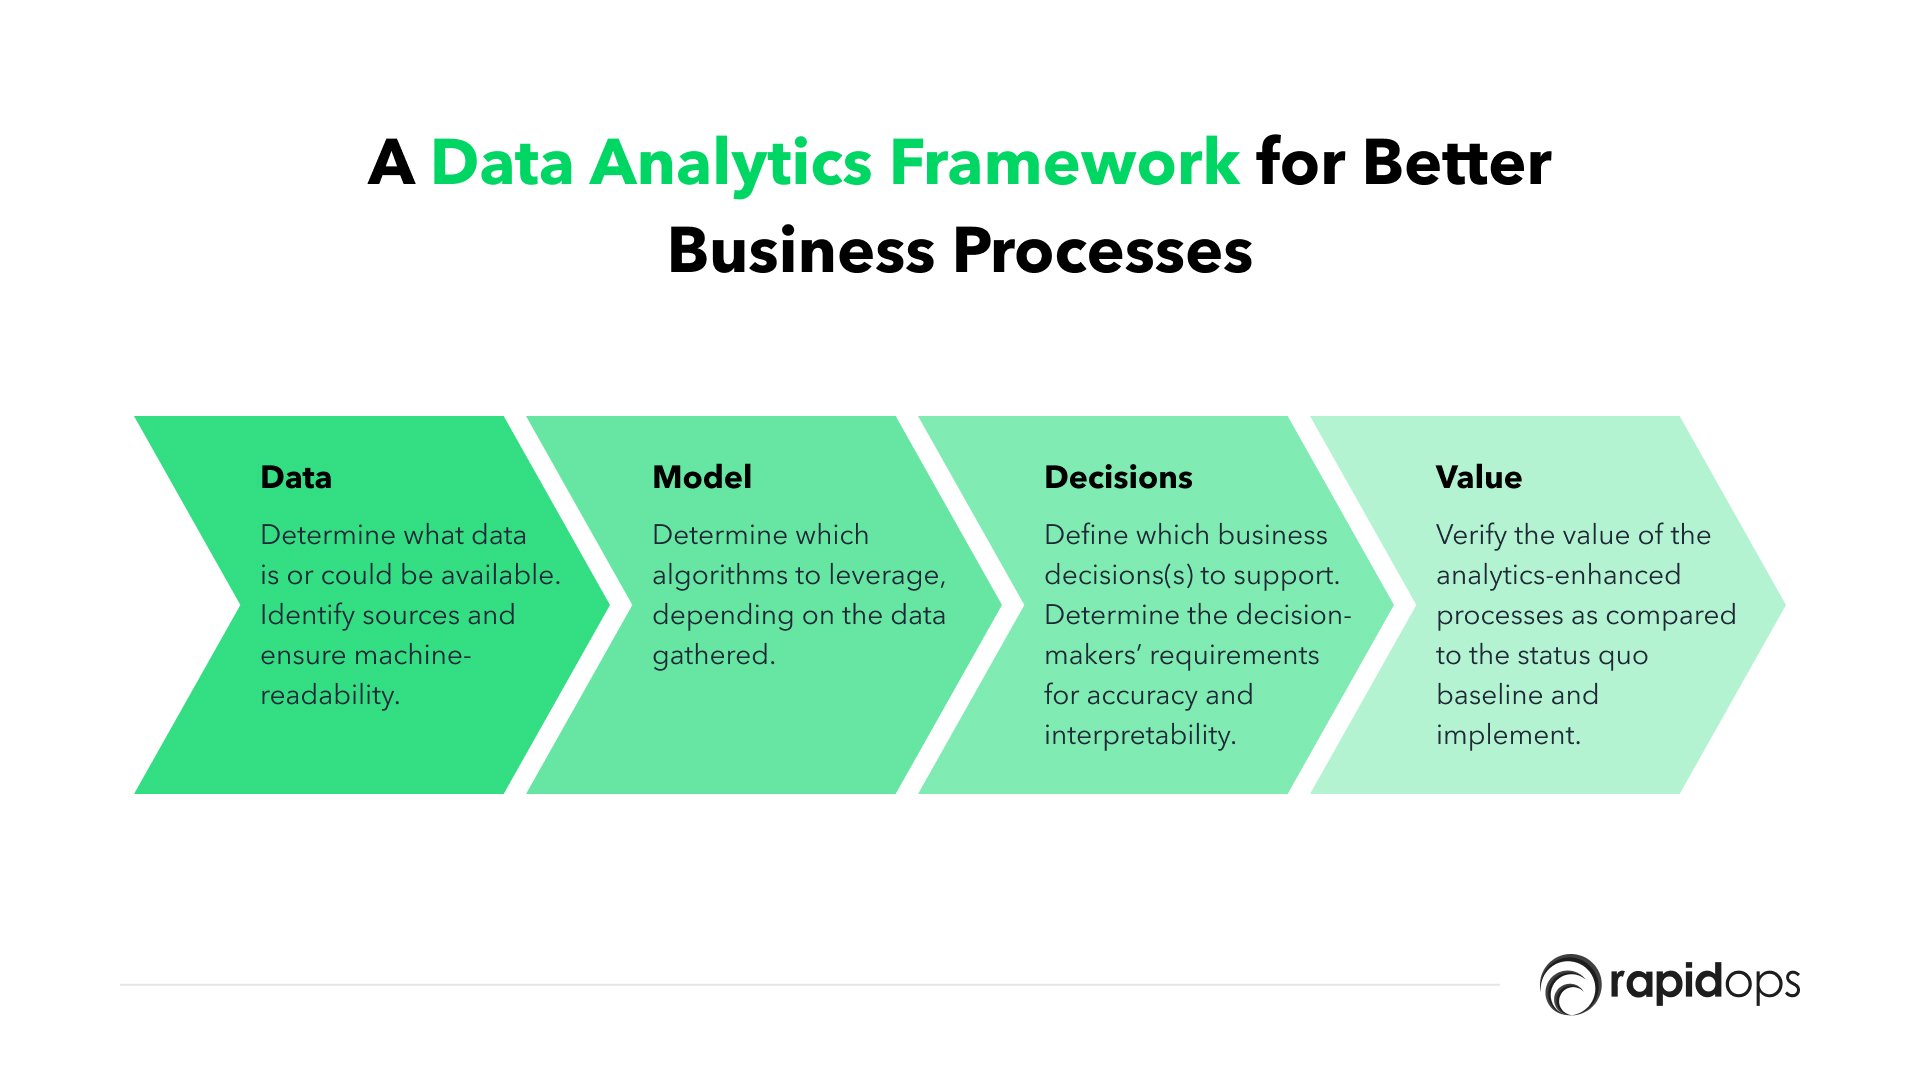
To get you started on your data analytics implementation journey, here is a generalized framework on which business owners can base their further data analytics steps:
The framework starts with data, the most crucial aspect of analytics.
Locating the right data, cleaning it, and molding it to serve your needs requires experience and understanding - Rapidops
Following data collection, organizations must determine which models to utilize.
The results of these models impact decisions regarding assembling a data team, selecting the best tools, picking the right variables, and creating effective visuals—all of which should ultimately deliver value to the organization.
For instance, consider an equity firm, let's call it Rapid Equity, planning a significant investment in a growth company it has identified.
The data analytics framework would involve the following:
1. Data
Rapid Equity must gather pertinent data on the target firm's earnings, including consistency, repeatability, and quality.
2. Models
Rapid Equity must develop a predictive model that accounts for all factors affecting earnings and examines previous situations to comprehend potential earnings growth—selecting the appropriate model, such as linear regression or a machine-learning tree-based model.
3. Decisions
This stage focuses on assessing risk and making well-informed decisions based on various model outcomes, which should predict the drivers leading to high or low revenue.
4. Value
By this point, Rapid Equity should establish clear expectations about the potential value of investing in the target company, including the anticipated return on investment and the capacity to maintain a relatively low-risk profile.
Concluding thoughts: Data may seem daunting, but not when you have experts with you!
The business landscape is increasingly becoming data-driven, and organizations must adopt robust data analytics strategies that help them make informed decisions and create a competitive edge.
We hope this article provided insights into the importance of data and analytics, its types, use cases, the steps to implementing it, common challenges, evaluating its effectiveness, measuring impact, and the significance of continuous improvement.
Our seasoned team of experts is equipped to help you navigate this journey by addressing data quality issues, creating a centralized data repository, and building intuitive dashboards that provide valuable insights.
As a leader in providing data and analytics services, Rapidops has a proven track record of helping businesses successfully implement data analytics strategies tailored to their unique needs.
Get on a quick discovery call to learn more about your data capabilities and where Rapidops can weave its services to turn your data into a growth fuel.

What’s Inside
- How can data analytics transform businesses and drive growth?
- A typical data analytics process
- Challenges of implementing data analytics in an organization
- Business analytics vs. data analytics: An in-depth comparison
- A basic understanding of data analytics types
- The evolution of analytics
- Steps to implementing data analytics solutions
- A data analytics framework for business owners
- Concluding thoughts: Data may seem daunting, but not when you have experts with you!

Let’s build the next big thing!
Share your ideas and vision with us to explore your digital opportunities
Similar Stories
- Analytics
- undefined Mins
- July 2019


Receive articles like this in your mailbox
Sign up to get weekly insights & inspiration in your inbox.