

Knowing the different data analytics types is essential for making informed decisions and gaining valuable insights from your data.
This article, which is also part of an entire data analytics series, will cover:
- Importance of understanding data analytics types
- Their definitions
- Various use cases
- Factors to consider when selecting a type
- Industry implementation
Importance of knowing the different types of data analytics
1. Meet data goals and objectives
By comprehending the different data analytics types, organizations can select the method that best aligns with their data objectives and results in a proper analysis that is tailored to their specific needs.
For example, a retail company that wants to improve customer satisfaction can employ predictive analytics to analyze behavior and preferences.
This enables personalized marketing campaigns and product recommendations, resulting in improved experiences, increased loyalty, and higher revenue – a critical aspect of strategic decision-making for business owners and decision-makers.
2. Optimize business processes and decision-making
With a deeper understanding of data analytics types, organizations can employ the most suitable techniques for uncovering valuable insights used to:
- Improve business processes
- Streamline operations
- Make informed decisions
- Increase efficiency and profitability
3. Gain a competitive edge within the industry
Knowing the different data analytics types and their applications allows organizations to stay ahead of the competition.
By leveraging the most relevant analytics techniques, businesses can uncover trends, patterns, and opportunities that competitors may overlook, giving them a strategic upper hand.
This is particularly beneficial in manufacturing, where process optimization can lead to significant cost savings.
Definitions and use cases of the four main types of data analytics
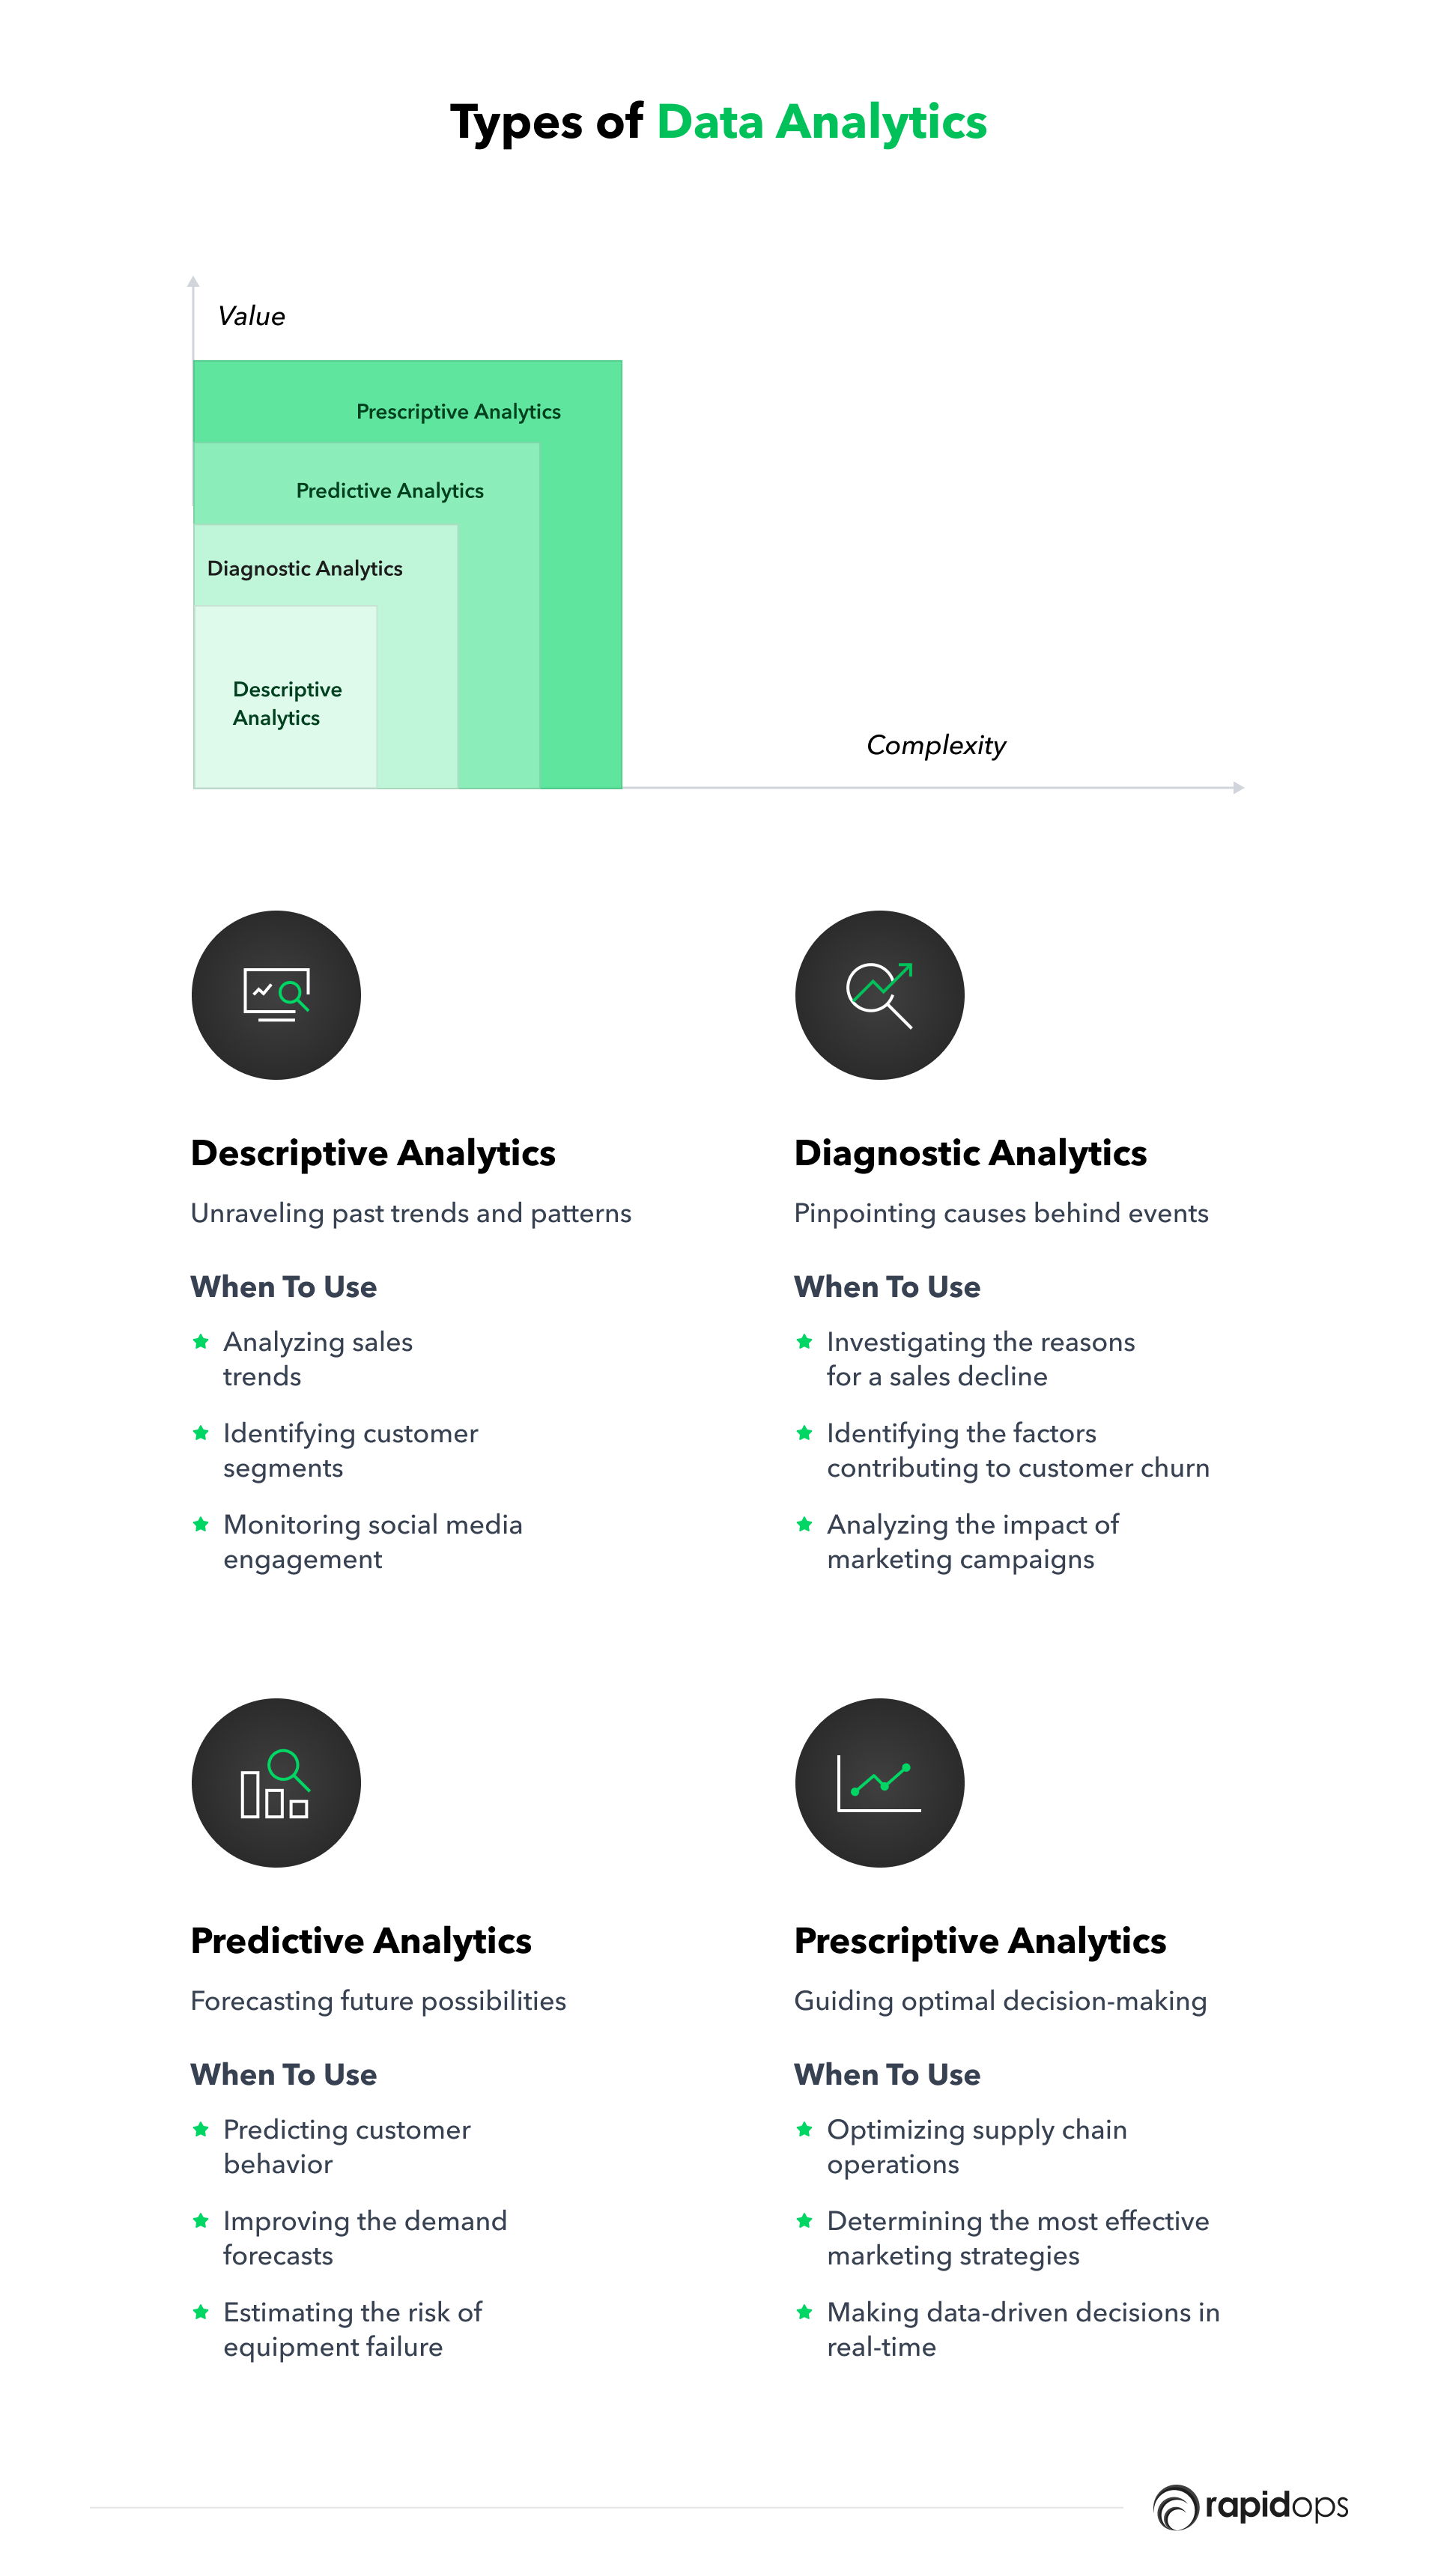
1. Descriptive analytics
Descriptive analytics is a fundamental, elementary type of analysis that examines what has transpired in the past.
The primary techniques employed in descriptive analytics are data aggregation and data mining. In the former, the data analyst initially collects the data and presents it in a summarized format (the aggregation aspect) before "mining" the data to identify patterns.
The data is then displayed in a manner that is easily understandable to a broad audience (not solely data experts).
It's crucial to understand that descriptive analytics doesn't attempt to explain the historical data or establish cause-and-effect relationships; at this point, it's merely about identifying and describing the "what."
When to use descriptive analytics?
- Analyzing sales trends
- Identifying customer segments
- Monitoring social media engagement
For example, a retail store analyzes its sales data from the past year to determine the most popular products, peak shopping times, and customer demographics. This information helps the store understand its overall sales performance and make better-informed future decisions.
2. Diagnostic analytics
While descriptive analytics focuses on the “what,” diagnostic analytics delves into the "why" behind the data.
In diagnostic analytics, organizations must first pinpoint anomalies within their data, such as unexplained occurrences or deviations from the norm.
For example, if a sudden drop in sales is observed, an organization would initiate a discovery phase investigation into the cause, seeking out additional data sources that could provide more information on the origin of the anomalies.
The ultimate goal is to reveal causal relationships, such as events that might correlate with or be linked to the decrease in sales. During this process, organizations may employ:
Probability theory
A mathematical way of analyzing and modeling random events to help businesses make better decisions and predictions based on the likelihood of various outcomes.
Regression analysis
A statistical technique of identifying key factors that influence target outcomes and predicting future trends based on historical data to help businesses optimize their strategies.
Filtering
A data processing technique used for removing or isolating specific information, focusing on relevant data points, and ensuring accurate and reliable insights.
Time-series data analytics
Specialized analysis of data collected over time, such as monthly sales, that is used for identifying trends, seasonal patterns, and time-dependent factors to assist businesses in improving efficiency and profitability.
Sounds too complicated and time-consuming? This is where our team of data experts can step in to make life and processes easier for you!
When to use diagnostic analytics?
- Investigating the reasons for a sales decline
- Identifying the factors contributing to customer churn
- Analyzing the impact of marketing campaigns
For example, an e-commerce company experiences a sudden drop in sales during a particular month. Diagnostic analytics is used to identify the cause by examining various factors, such as website traffic, marketing campaigns, and competitors' promotions.
This allows the company to pinpoint the reasons behind the sales decline and implement measures to prevent it from re-occurring.
3. Predictive analytics
As the name implies, predictive analytics aims to anticipate what will likely occur in the future. This is where organizations begin to generate actionable, data-driven insights that can be leveraged to guide their subsequent actions.
Predictive analytics employs historical data and probability theory to estimate the likelihood of a future outcome. While it can never be entirely precise, it does remove much of the guesswork from crucial business decisions.
Predictive analytics can project a wide range of outcomes—from which products are likely to be most in demand during a specific timeframe to the anticipated increase or decrease in company revenue within a given period.
Predictive analytics enhances a business's odds of "hitting the target" and implementing the most suitable action.
When to use predictive analytics?
- Predicting customer behavior
- Forecasting demand
- Estimating the risk of equipment failure
For example, a manufacturing company uses predictive analytics to estimate the risk of equipment failure in its production line.
The company can predict the likelihood of equipment failure by analyzing historical data, such as maintenance records, machine runtime, and previous breakdowns. This enables them to schedule preventive maintenance, minimize production downtime, and reduce overall costs.
4. Prescriptive analytics
Prescriptive analytics employs advanced techniques to predict future events and suggests the most effective strategies for achieving specific targets or objectives.
While predictive analytics focuses on forecasting what might happen in the future based on historical data, prescriptive analytics goes a step further, offering specific recommendations on how to achieve desired outcomes or navigate potential challenges.
This key difference makes prescriptive analytics a more actionable and strategic approach to data-driven decision-making. It delivers actionable guidance and insights by utilizing optimization methods, simulation modeling, and decision-support algorithms.
Prescriptive analytics empowers organizations to streamline their operations, enhance decision-making, and boost overall productivity by recommending the most appropriate actions after considering a range of factors and potential scenarios.
When to use prescriptive analytics?
- Optimizing supply chain operations
- Determining the most effective marketing strategies
- Making data-driven decisions in real-time
For example, a manufacturing company wants to optimize its production schedule to meet increasing demand while minimizing costs. Prescriptive analytics analyzes various factors, such as raw material availability, workforce capacity, and equipment efficiency.
Based on this analysis, the system recommends the optimal production plan, including the best sequence of production runs, staffing levels, and maintenance schedules, to meet the objectives efficiently.
Factors to consider when selecting a type of data analytics
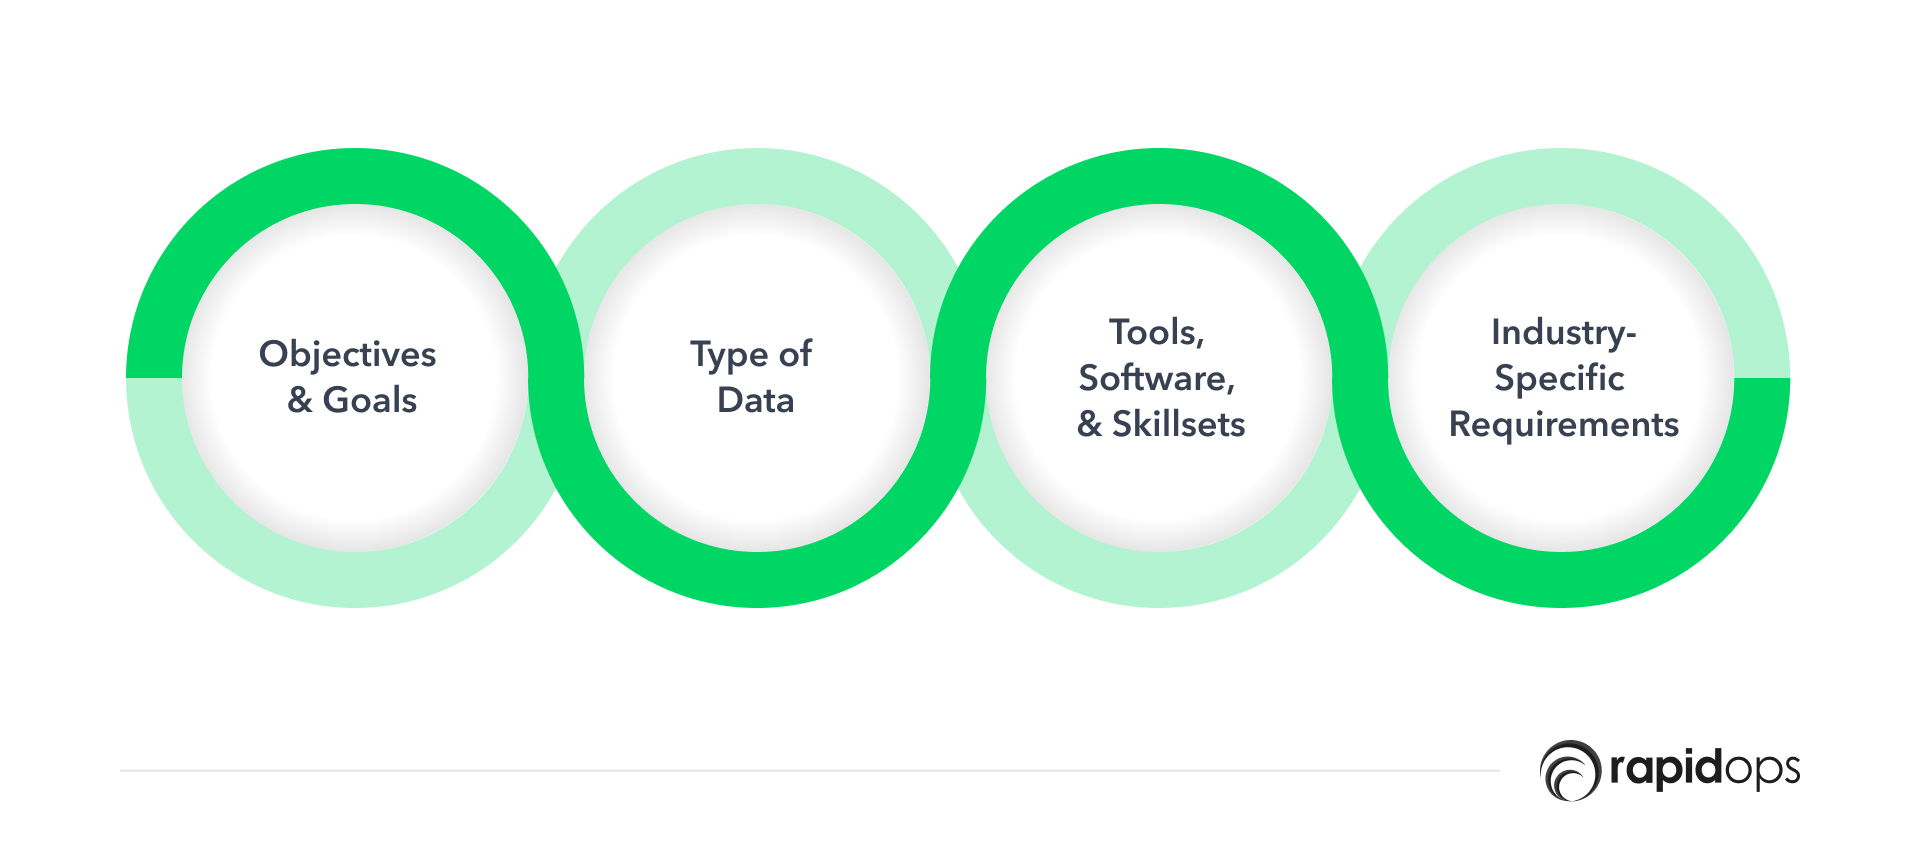
1. Business objectives and goals
Understanding your organization's objectives and goals is essential for determining the most suitable data analytics approach. The chosen method should align with your strategic priorities and provide actionable insights to facilitate decision-making and drive business growth.
2. Type of data available
The nature of the data available plays a significant role in selecting the right data analytics type.
For instance, historical data is suitable for descriptive and diagnostic analytics, whereas real-time data can be used for predictive and prescriptive analytics.
Assess the data's quality, format, and volume to determine the appropriate analytics method.
3. Available resources, including tools, software, and skillsets
The availability of resources, such as tools, software, and skilled personnel, should be considered when selecting the appropriate data analytics type.
Evaluate your current technology infrastructure and the expertise of your team members to determine if you have the necessary resources to implement the chosen analytics method effectively.
4. Industry-specific requirements and best practices
Industries have diversified requirements, regulations, and best practices that influence the selection of data analytics types.
Consider the specific needs of your industry and the potential impact of various analytics approaches on your organization's performance and compliance. Research industry benchmarks and case studies to identify and choose the most effective analytics methods.
Implementation of data analytics types in various industries
Here’s how various industries may implement the different data analytics types
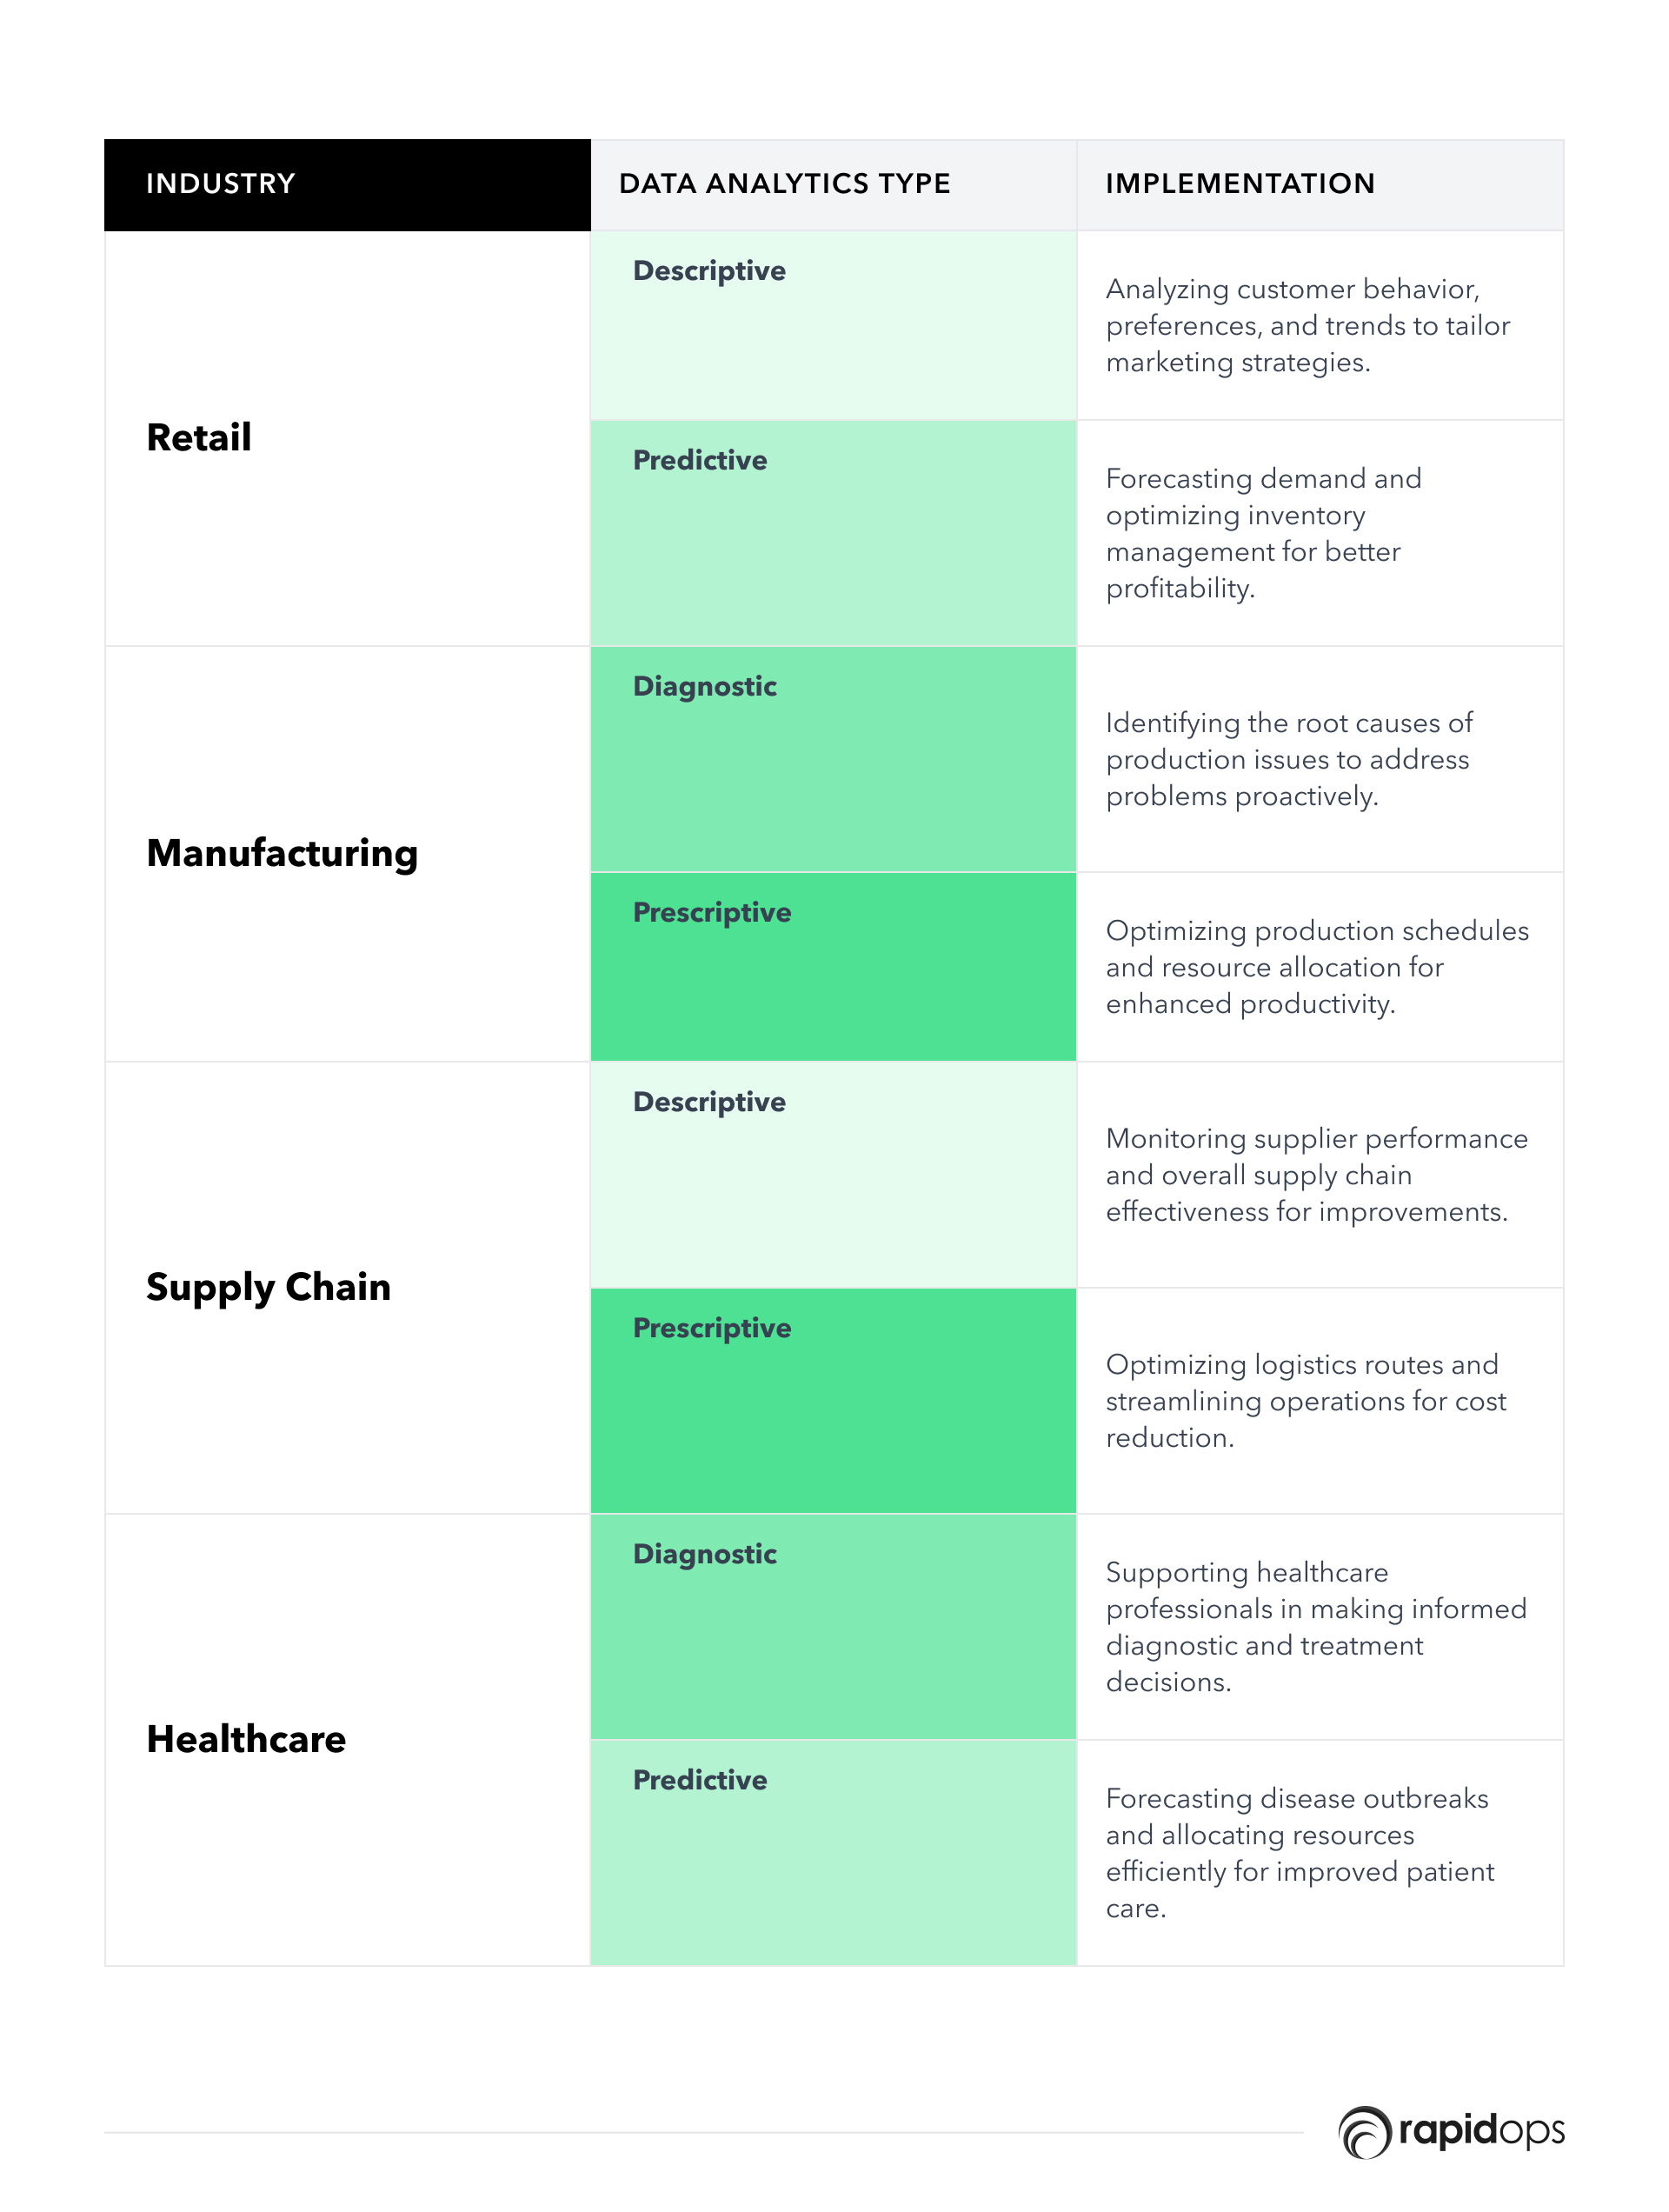
1. Retail
Descriptive analytics
Descriptive analytics in retail examines customer behavior, preferences, and trends through historical data. It enables retailers to understand their audience, identify popular products, and recognize shopping patterns.
Consequently, retailers can develop tailored marketing strategies to enhance customer satisfaction and drive sales.
Predictive analytics
Predictive analytics in retail uses advanced techniques to forecast demand, optimize inventory management, and maintain appropriate inventory levels. By analyzing past sales data, seasonal patterns, and external factors, retailers can anticipate future trends, improve supply chain efficiency, and enhance profitability.
2. Manufacturing
Diagnostic analytics
Diagnostic analytics in manufacturing identifies the root causes of production issues, such as equipment failures or process inefficiencies.
Analyzing historical data and performance metrics allows manufacturers to pinpoint problem areas and address them proactively, minimizing downtime, improving product quality, and reducing production costs.
Prescriptive analytics
Prescriptive analytics in manufacturing optimizes production schedules, resource allocation, and workflow by recommending data-driven decisions.
It enhances overall productivity, minimizes waste, and maximizes resource utilization by considering factors such as machine capacity, labor availability, and material constraints.
3. Supply Chain
Descriptive analytics
Descriptive analytics in supply chain management monitors supplier performance, transportation efficiency, and overall supply chain effectiveness.
Analyzing historical data and key performance indicators helps companies identify areas for improvement, strengthen supplier relationships, and streamline their operations.
Prescriptive analytics
Prescriptive analytics in supply chain management optimize logistics routes, minimize costs, and streamline operations by considering factors such as transportation costs, lead times, and capacity constraints.
It helps companies develop optimal routing plans, ensure timely deliveries, and reduce the impact of disruptions.
4. Healthcare
Diagnostic analytics
Diagnostic analytics in healthcare examines patient data, identifies disease patterns, and supports healthcare professionals in making informed diagnostic and treatment decisions.
Analyzing electronic health records, lab results, and medical imaging data aids in the early detection of health issues, personalized treatment plans, and improved patient outcomes.
Predictive analytics
Predictive analytics in healthcare forecasts disease outbreaks anticipates patient outcomes and allocates resources efficiently.
It enables healthcare organizations to develop early warning systems, prioritize high-risk patients, and manage resources effectively, contributing to improved patient care, reduced healthcare costs, and better public health management.
Frequently asked questions regarding types of data analytics
1. What is the process of data analytics?
The process of data analytics involves several stages that help organizations transform raw data into actionable insights. Here's a general overview of the data analytics process:
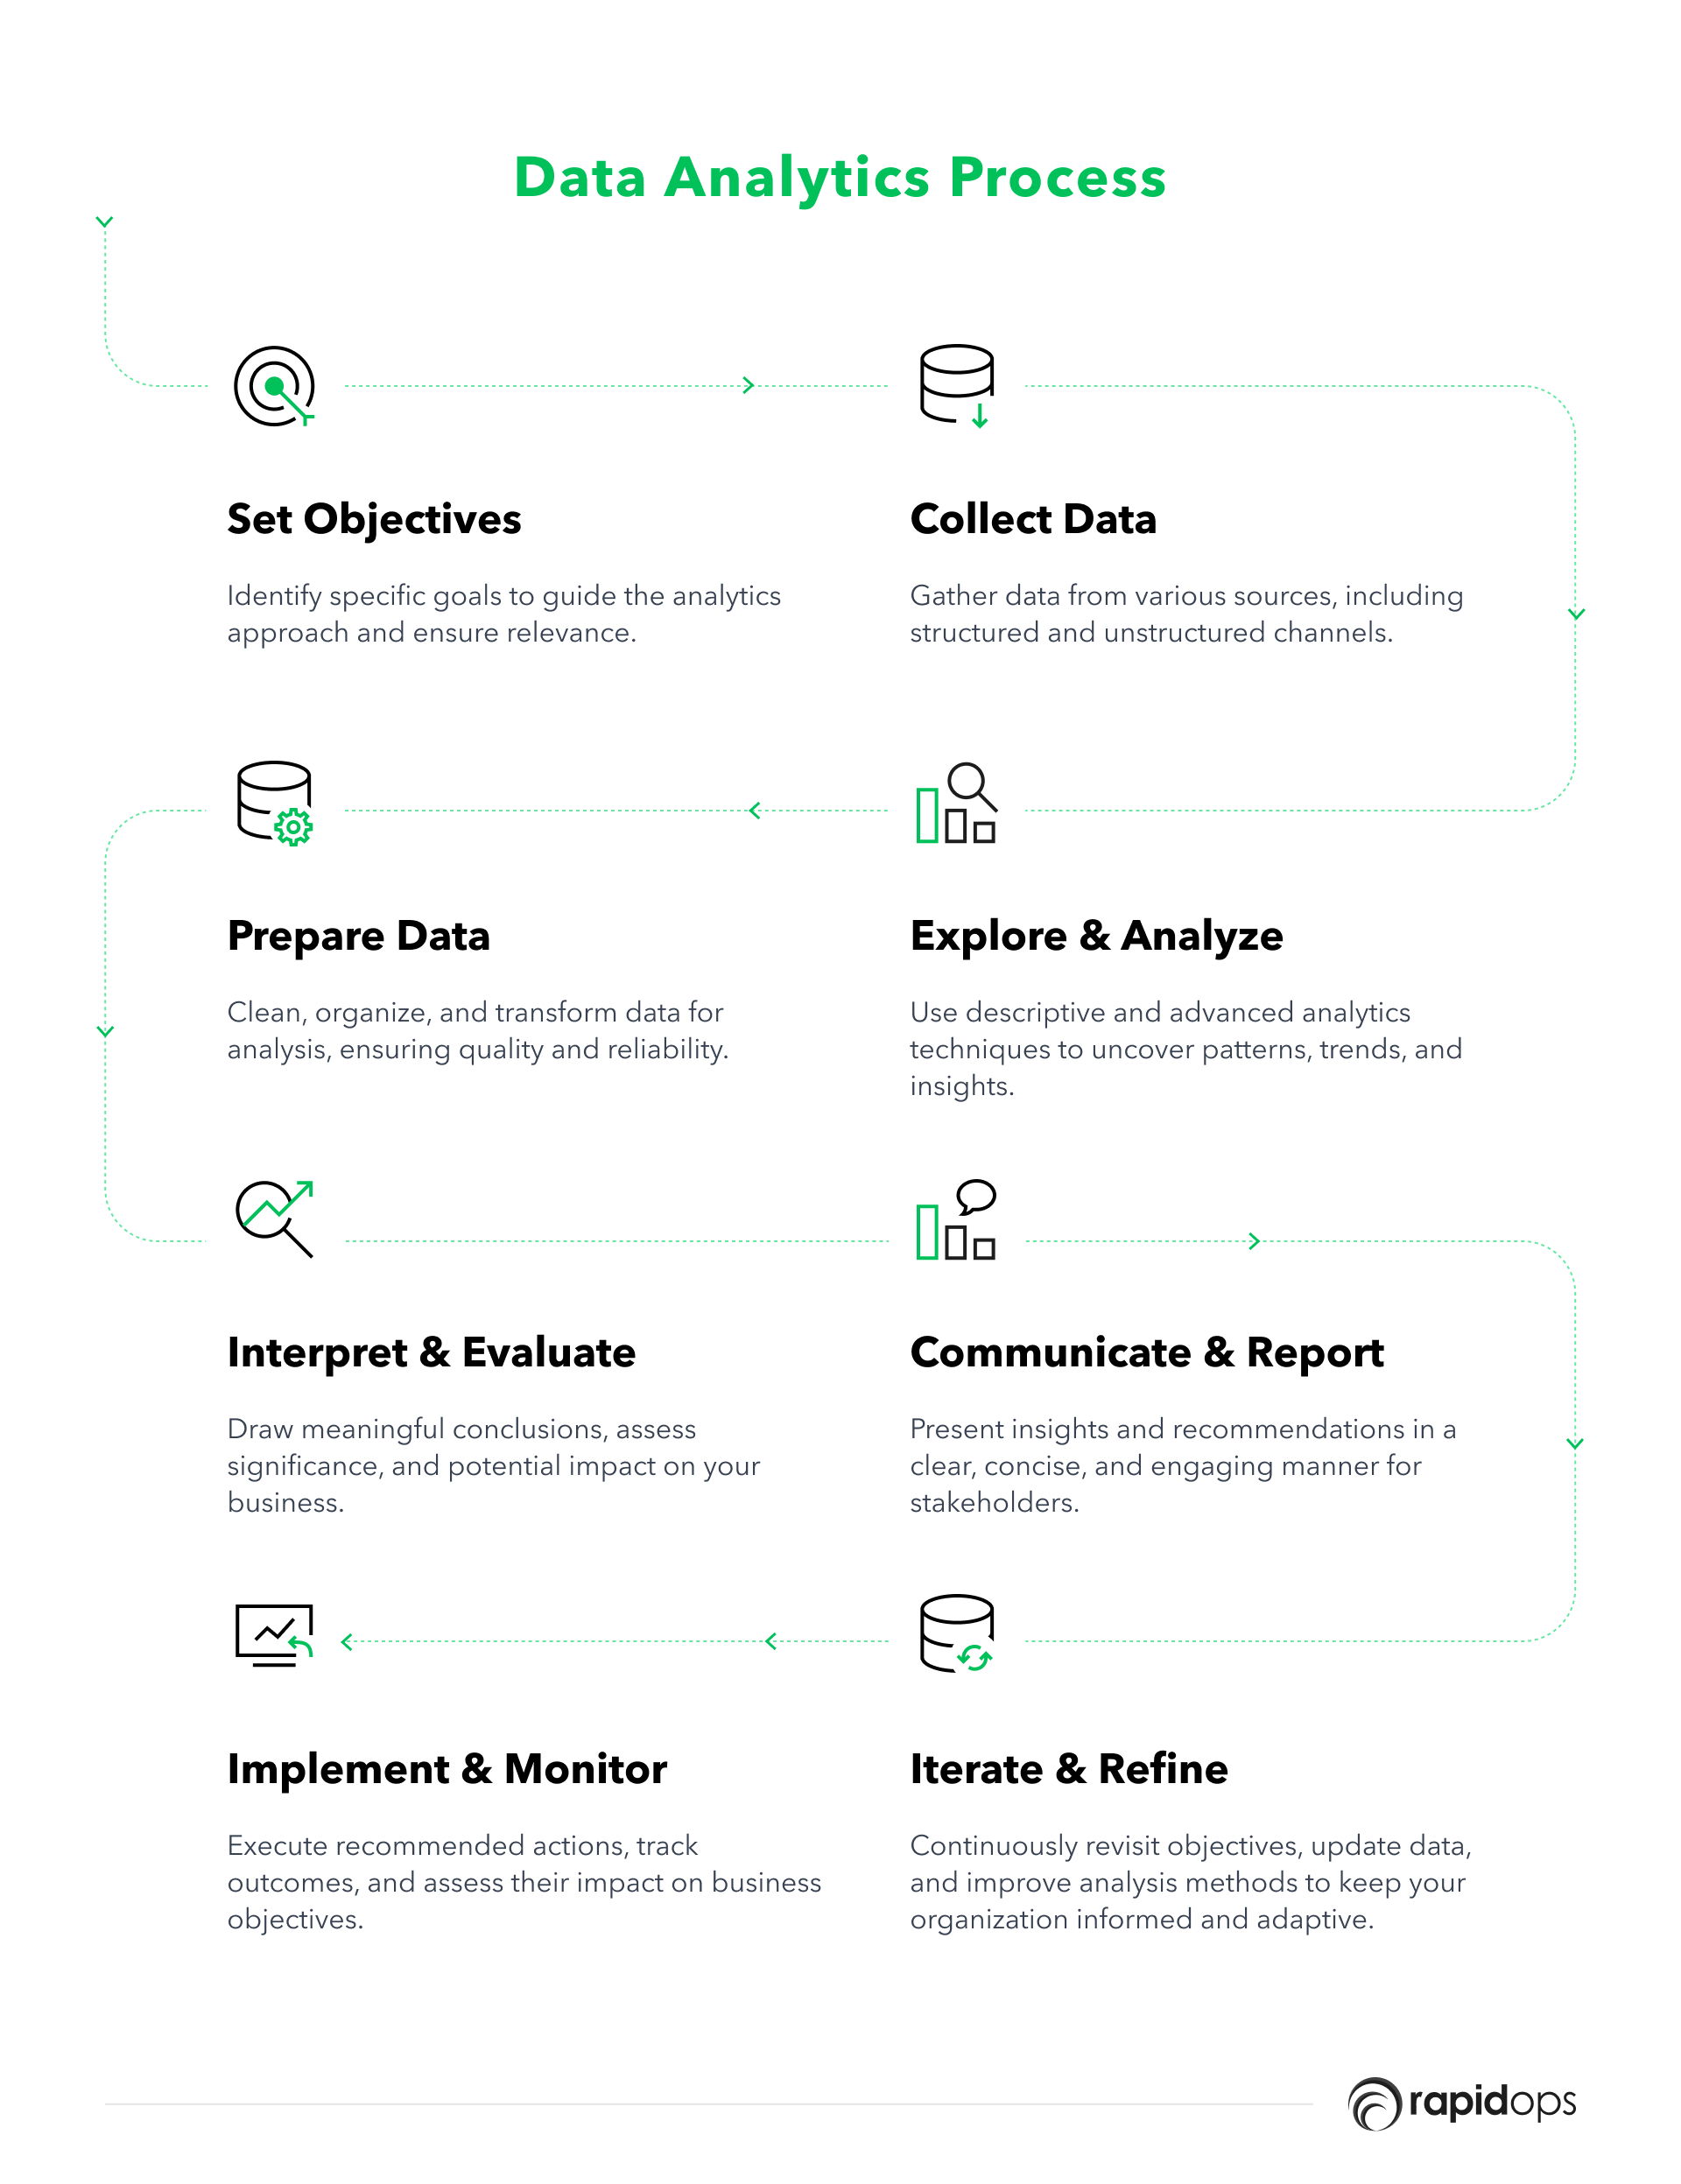
1. Define organization data objectives and goals
Start by identifying the specific business objectives or questions you want to address through data analytics. This will help guide your approach and ensure the analysis is relevant to your organization's needs.
2. Data collection
Gather the necessary data from various sources such as databases, data warehouses, APIs, or external data providers. Use Python web scraping to gather additional data from websites that don't offer direct access to structured data. This stage may involve both structured and unstructured data from different channels, including web traffic, customer transactions, social media, or IoT devices.
3. Data preparation and cleaning
Prepare the collected data for analysis by cleaning, organizing, and transforming it into a suitable format. This step may involve removing duplicates, filling in missing values, and correcting inconsistencies or errors. Proper data preparation is crucial for ensuring the quality and reliability of the analysis.
4. Data exploration and analysis
Explore the prepared data using descriptive analytics techniques to understand the underlying patterns and relationships. This step may involve creating visualizations, calculating summary statistics, and identifying trends.
Depending on the objectives, more advanced analytics methods (diagnostic, predictive, or prescriptive) may be applied to uncover deeper insights or forecast future outcomes.
5. Interpretation and evaluation
Interpret the analysis results to draw meaningful conclusions that address your objectives and goals. Evaluate the significance of the findings and assess their potential impact on your business.
6. Communication and reporting
Present the insights and recommendations derived from the analysis to relevant stakeholders in a clear, concise, and visually engaging manner. Effective communication is essential for ensuring the insights are understood and actionable by decision-makers.
7. Implement and monitor
Implement the recommended actions based on the insights gained from the analysis. Monitor the outcomes and track the progress of the implemented changes to assess their impact on your business objectives.
8. Iterate and refine
Data analytics is an ongoing process. Continuously revisit your objectives, collect new data, and refine your analysis methods to ensure your organization stays informed and adapts to changing circumstances.
Disclaimer: The data analytics process may vary depending on your organization's specific needs and goals and the tools and technologies employed in the analysis.
2. How do the data analytics types differ from each other?
The primary differences between the data analytics types lie in their objectives and the techniques used.
- Descriptive analytics focuses on understanding past events
- Diagnostic analytics aims to identify the causes of those events
- Predictive analytics forecasts future events
- Prescriptive analytics recommends actions to optimize outcomes
3. How can data analytics benefit my business?
Data analytics can help your business uncover insights, identify trends, and make more informed decisions. By leveraging data analytics, you can optimize operations, enhance customer experiences, improve marketing strategies, and uncover new opportunities for growth.
4. Which type of data analytics should my business use?
The right type of data analytics for your business depends on your objectives and the insights you're seeking. Most organizations start with descriptive analytics to understand their historical data, then progress to more advanced techniques like diagnostic, predictive, and prescriptive analytics as they gain more experience and capabilities.
5. What tools and technologies are commonly used in data analytics?
Popular data analytics tools and technologies include programming languages like Python and R, data visualization tools like Tableau and Power BI, and advanced analytics platforms like SAS and IBM SPSS.
Conclusion: The right data analytics type depends on your industry
In today's digital era, data is king. As massive amounts of data are generated across industries, extracting valuable insights from that data is increasingly vital to a business's survival and success. Understanding and selecting the right type of data analytics for your business is essential to unlocking valuable insights and driving growth.
With over 13+ years of experience in developing digital products and data analytics solutions, Rapidops Inc. is your ideal partner for navigating the complexities of data analytics.
Our team of experts will help you identify the most suitable analytics techniques tailored to your business goals. This will enable you to optimize processes, make data-driven decisions, and gain a competitive edge in your industry.
Partner with Rapidops Inc. today to harness the power of data analytics and propel your business forward.

What’s Inside
- Importance of knowing the different types of data analytics
- Definitions and use cases of the four main types of data analytics
- Factors to consider when selecting a type of data analytics
- Implementation of data analytics types in various industries
- Frequently asked questions regarding types of data analytics
- Conclusion: The right data analytics type depends on your industry

Let’s build the next big thing!
Share your ideas and vision with us to explore your digital opportunities
Similar Stories
- Analytics
- undefined Mins
- July 2019


Receive articles like this in your mailbox
Sign up to get weekly insights & inspiration in your inbox.