

Discover the secret weapon successful business leaders use to transform their cost base and supercharge efficiency.
Data analytics isn't just about numbers—it's about uncovering profit opportunities hidden within your existing operations, enabling smarter, faster, and more profitable decisions.
Before moving ahead, we have a few questions for you. Are you feeling the heat? Is cutting costs without sacrificing efficiency a constant struggle and a bummer in your operations?
If yes, then this article is the right destination for unlocking those hidden cost-saving opportunities that will help you skyrocket your operational efficiency.
Introduction to data analytics
Let's talk data—but not just any data. We're diving into how the clever use of data analytics is not just a buzzword but a game-changer.
You know the basics: data is everywhere, from customer feedback to sales reports. But the magic lies in transforming this avalanche of numbers into insights and actionable strategies that boost your bottom line.
Efficiency and productivity have been the driving forces behind the introduction of technology in the modern business environment. For more insights on how data analytics can transform various industries, check out our manufacturing industry page.
According to a McKinsey Global Institute report, organizations that extensively use data analytics are 23 times more likely to outperform their competitors regarding customer acquisition, six times more likely to retain customers, and 19 times more likely to be profitable.
Sure, data analytics tools can dent your budget, but imagine them as the ace up your sleeve. Every dollar spent is a step toward outsmarting the competition and pinpointing cost-saving moves you didn’t even know were possible.
Ready to see how?
Let’s crunch some numbers and discover the ROI that turns ‘cost’ into ‘investment.’
Benefits of data analytics for businesses
A study by Nucleus Research found that companies that invested in data analytics achieved an average ROI of $13.01 for every dollar spent.
Data analytics can provide businesses with numerous benefits, including:
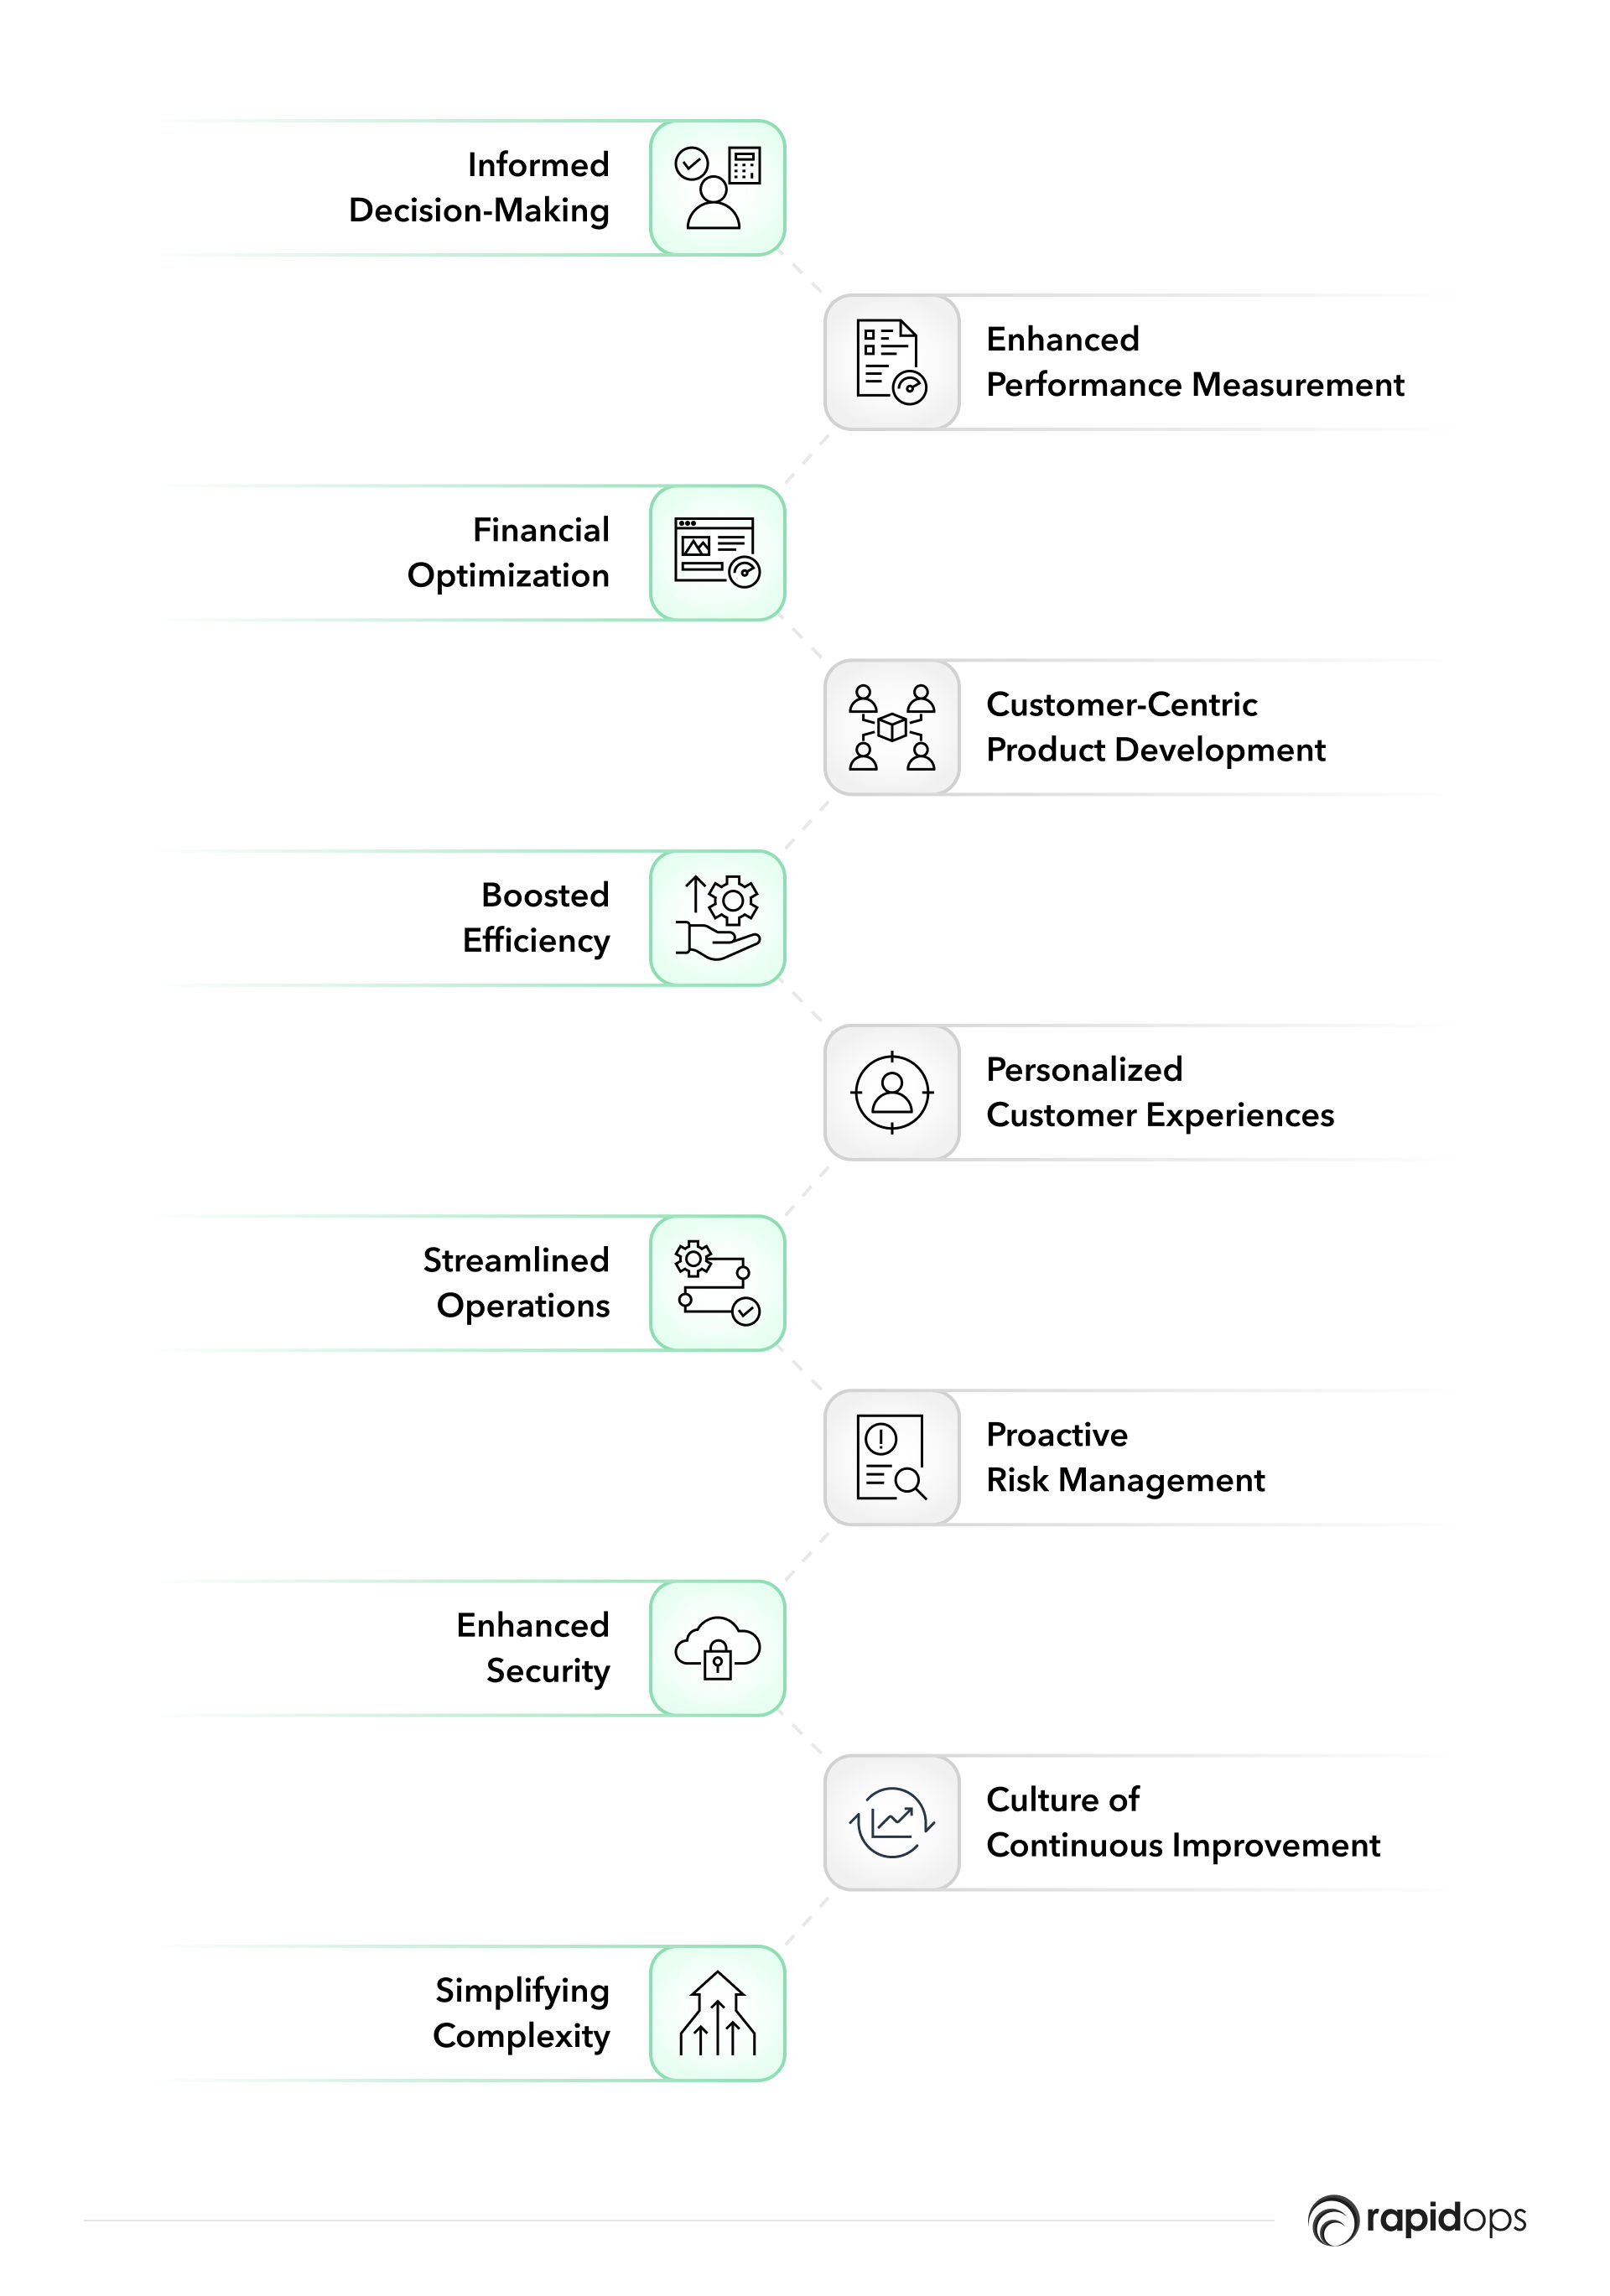
- Informed decision-making: Data analytics transforms decision-making processes by providing concrete, evidence-based insights. This leads to more strategic and effective outcomes.
- Enhanced performance measurement: Through data analytics, companies can accurately gauge performance. Tracking trends and pinpointing improvement areas allow for the implementation of targeted, data-driven strategies.
- Financial optimization: Data analytics is central to finance. It helps forecast future trends, streamline financial reporting, and analyze economic shifts. This clarity enhances financial health and boosts revenue potential.
- Customer-centric product development: Data analytics enable businesses to gain insights into customer preferences and design products that truly resonate with their target markets.
- Boosted efficiency: Employing data analytics in daily operations helps test various methods, gather employee feedback, and refine processes, leading to increased operational efficiency.
- Personalized customer experiences: Utilizing data from multiple channels allows businesses to customize interactions, strengthening customer loyalty and satisfaction.
- Streamlined operations: Data analytics aids in identifying and eliminating process bottlenecks, facilitating a smoother operational flow.
- Proactive risk management: By predicting potential issues and vulnerabilities, data analytics enables businesses to mitigate risks effectively and manage setbacks efficiently.
- Enhanced security: Utilizing data analytics to detect potential security threats can help fortify a company’s defenses before issues arise.
- Culture of continuous improvement: Data analytics encourages ongoing refinement of business strategies. Monitoring the results of data-driven decisions allows for continuous adjustments, ensuring sustained success.
- Simplifying complexity: We strive to present these concepts in straightforward, accessible language to keep you engaged and informed.
Harnessing data analytics for industry-specific advantages
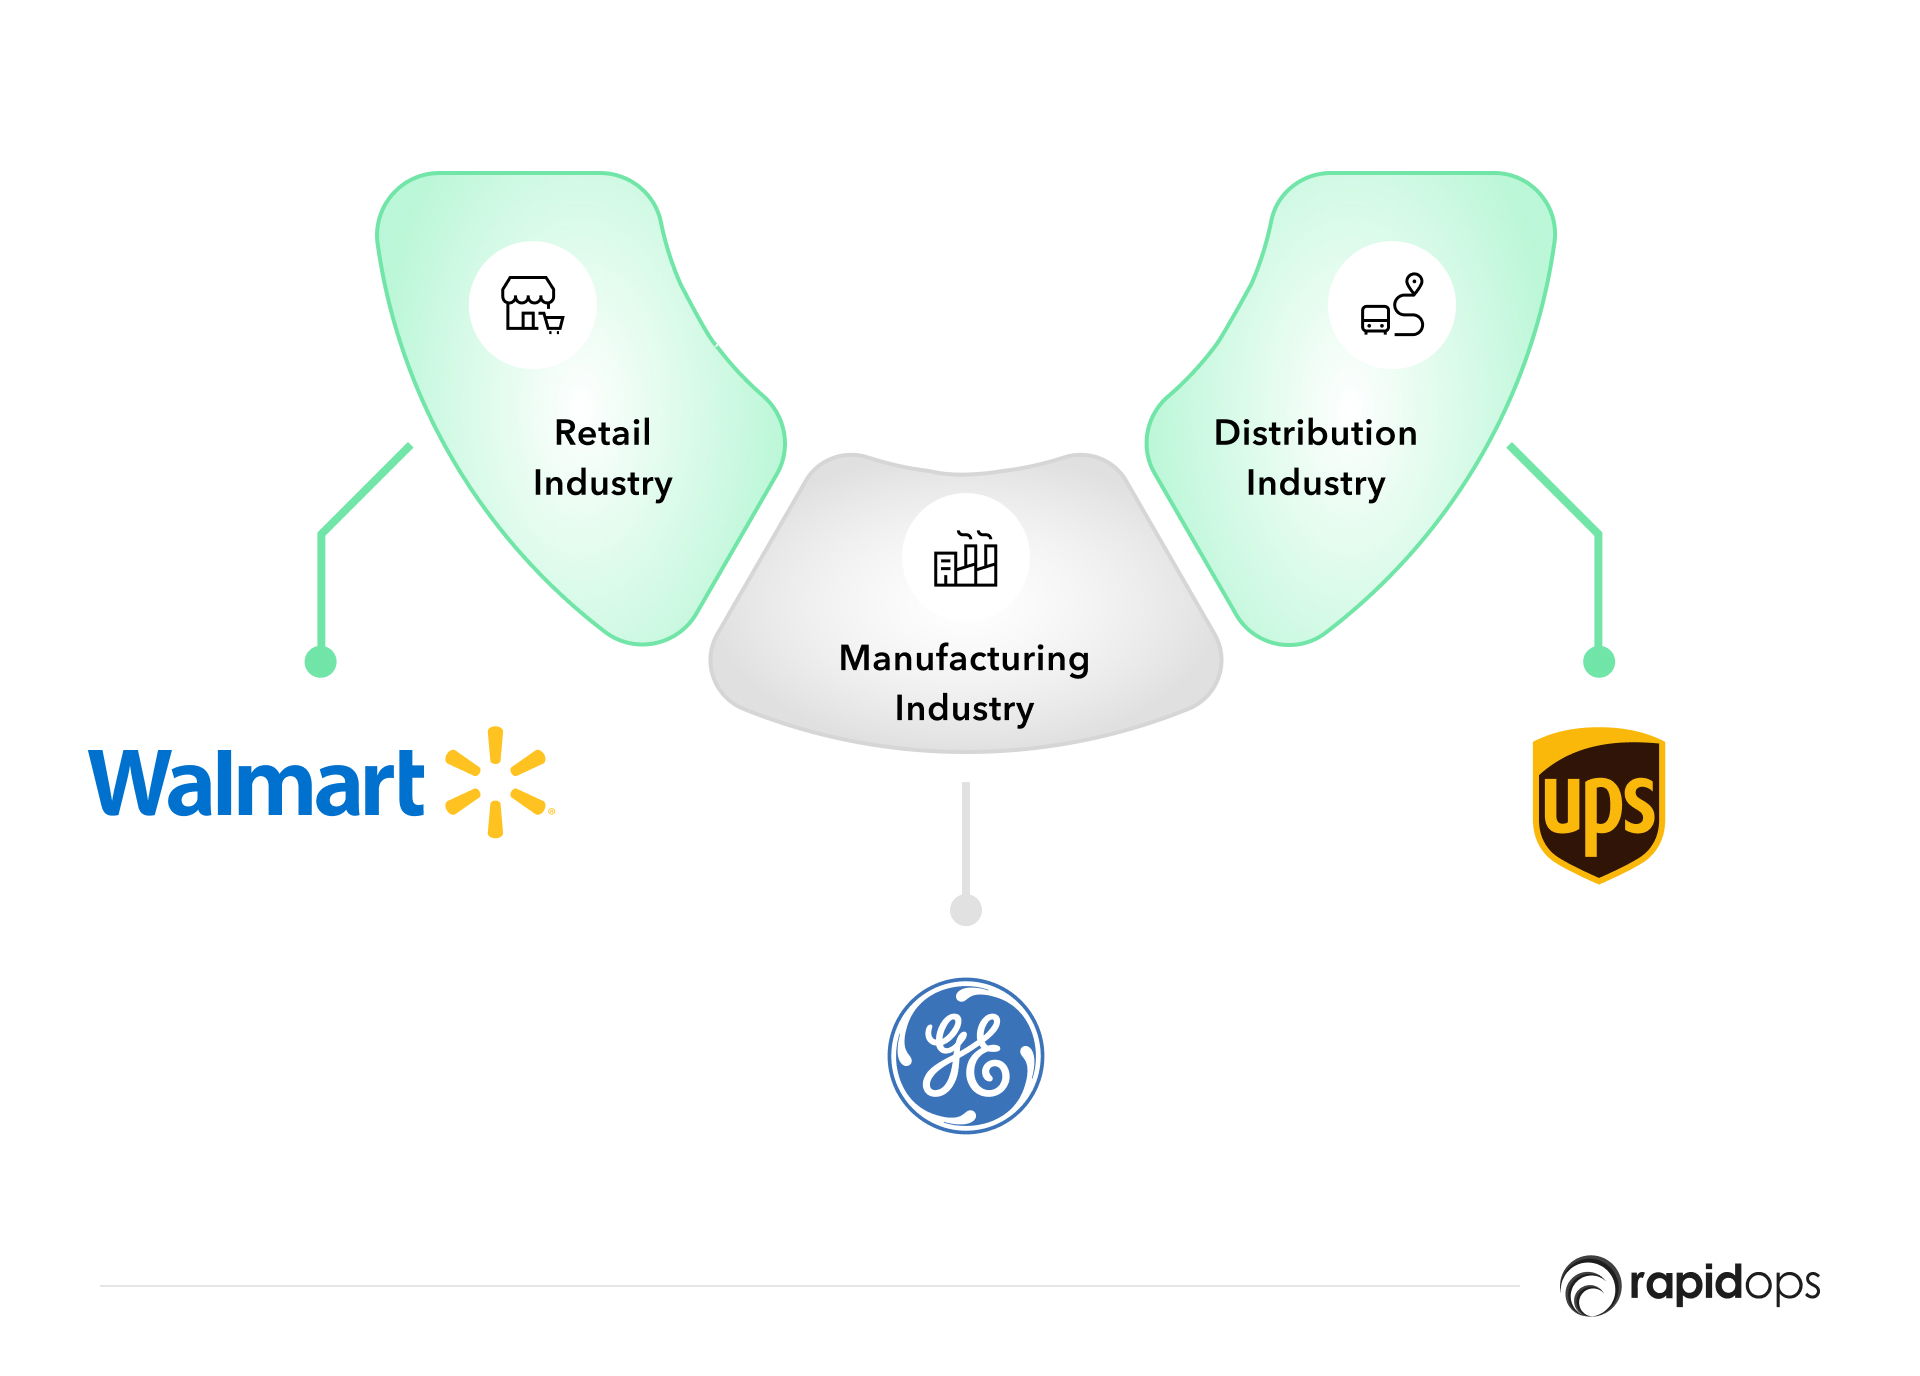
Retail industry: Walmart
- Implementation: Walmart leverages AI-powered inventory management systems, using historical data and predictive analytics to optimize the placement of items across its distribution centers and stores. This system is crucial for providing customers with needed items efficiently and at competitive prices.
- Outcome: This data management system has optimized the entire shopping experience, ensuring efficient item delivery and significantly enhancing customer satisfaction and operational efficiency.
Let's delve into how data analytics benefits specific sectors. Our detailed exploration of the retail industry demonstrates significant improvements in operational efficiency.
Manufacturing industry: General Electric (GE)
- Implementation: GE's Predix Platform is an IoT edge-to-cloud foundation that supports advanced data analytics for industrial applications. This platform enhances machine-to-machine communication and big-data analytics, which is crucial for distributed computing and asset data management.
- Outcome: This technology has increased the efficiency and lifespan of GE's machinery, leading to significant reductions in unplanned downtime and maintenance costs, thus boosting overall profitability.
Distribution industry: UPS
- Implementation: UPS employs its ORION system to optimize delivery routes. This system integrates data from vehicle sensors, package information, and external conditions to generate the most efficient driving routes for its fleet.
- Outcome: ORION's data-driven route optimization has reduced approximately 100 million miles driven annually, resulting in significant fuel savings, reduced maintenance costs, and enhanced delivery efficiency.
A leading US manufacturer used data analytics to drive cost reduction successfully
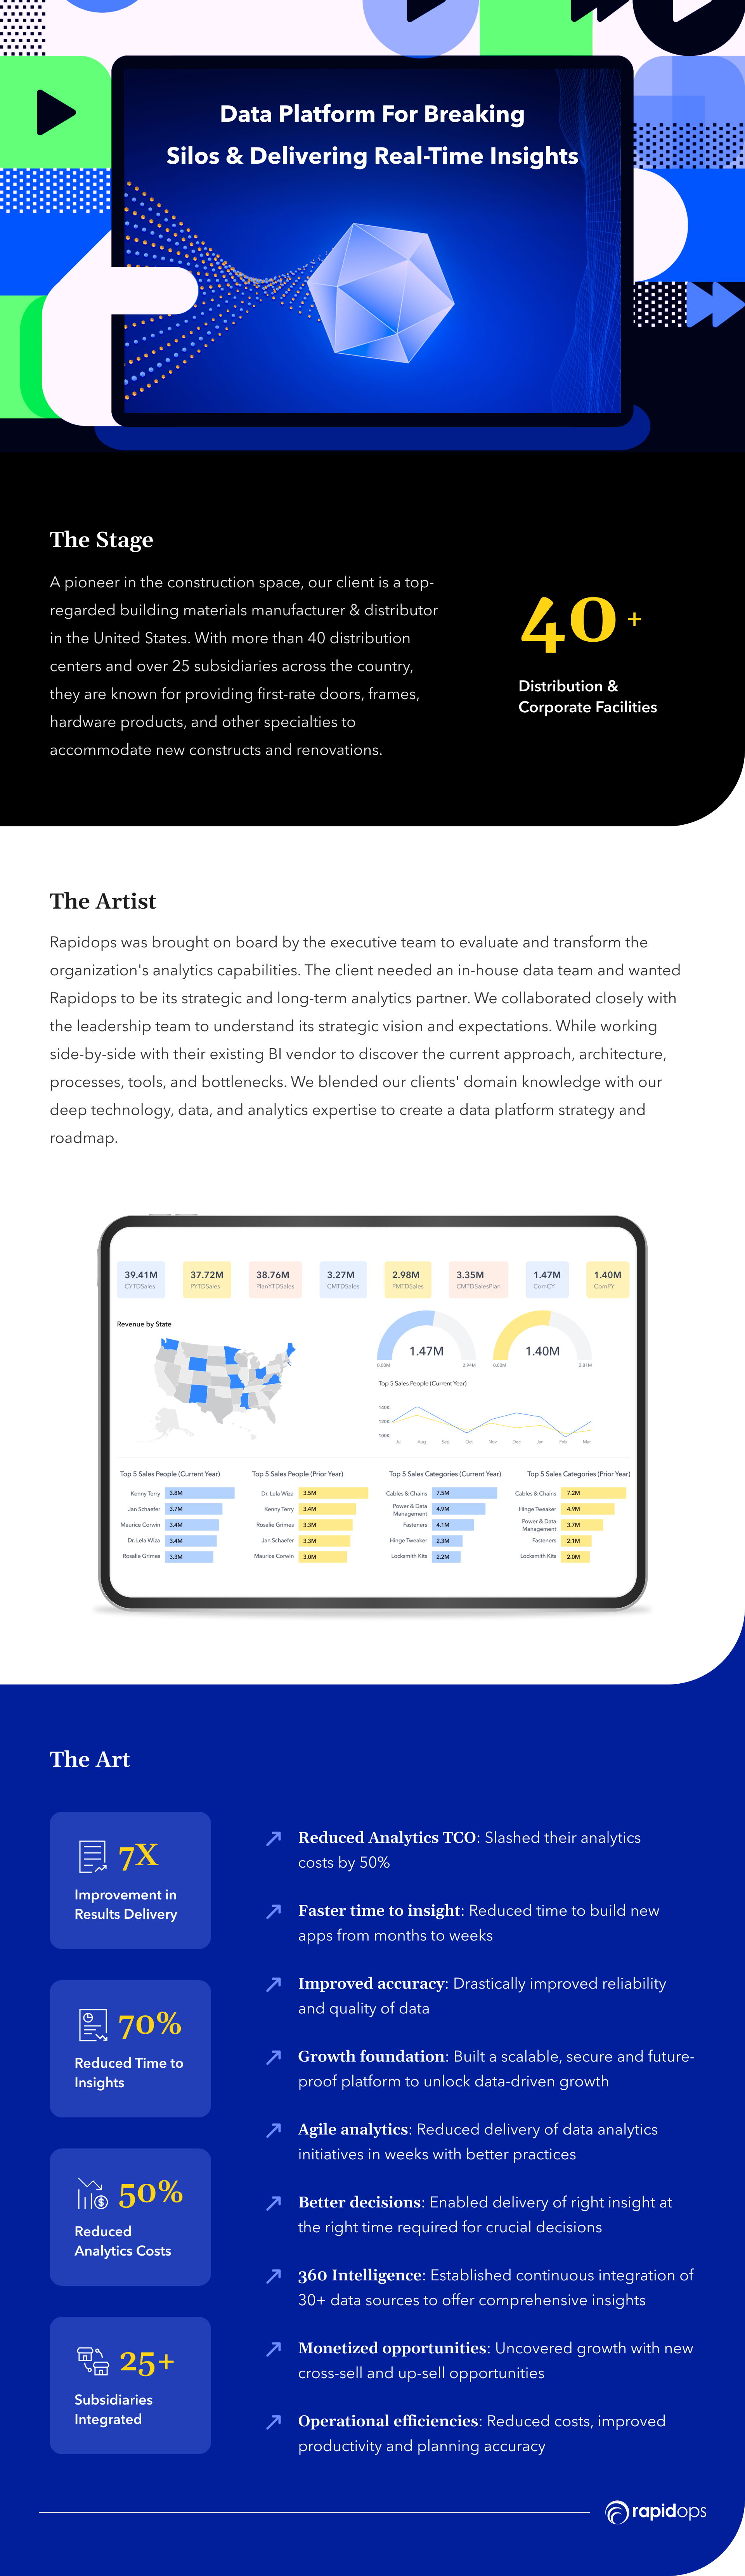
Our client, a leading building materials manufacturer and distributor in the United States, embarked on a rapid Mergers & Acquisitions (M&A) strategy to expand its market share.
Through our partnership with the client, we successfully leveraged data analytics to drive substantial cost reduction, improve operational efficiency, and empower data-driven decision-making.
This case study showcases the transformative power of data analytics in the construction industry, demonstrating its potential to enhance profitability and fuel growth.
- They faced challenges integrating data from over 40 distribution centers and 25 subsidiaries while optimizing operations, sales, costs, and resources.
- Their existing data warehouse was expensive to develop and manage, needing more robustness to deliver actionable insights.
- The key objectives were to reduce operational costs and create a scalable data and analytics foundation.
Specific areas where data analytics can cut costs
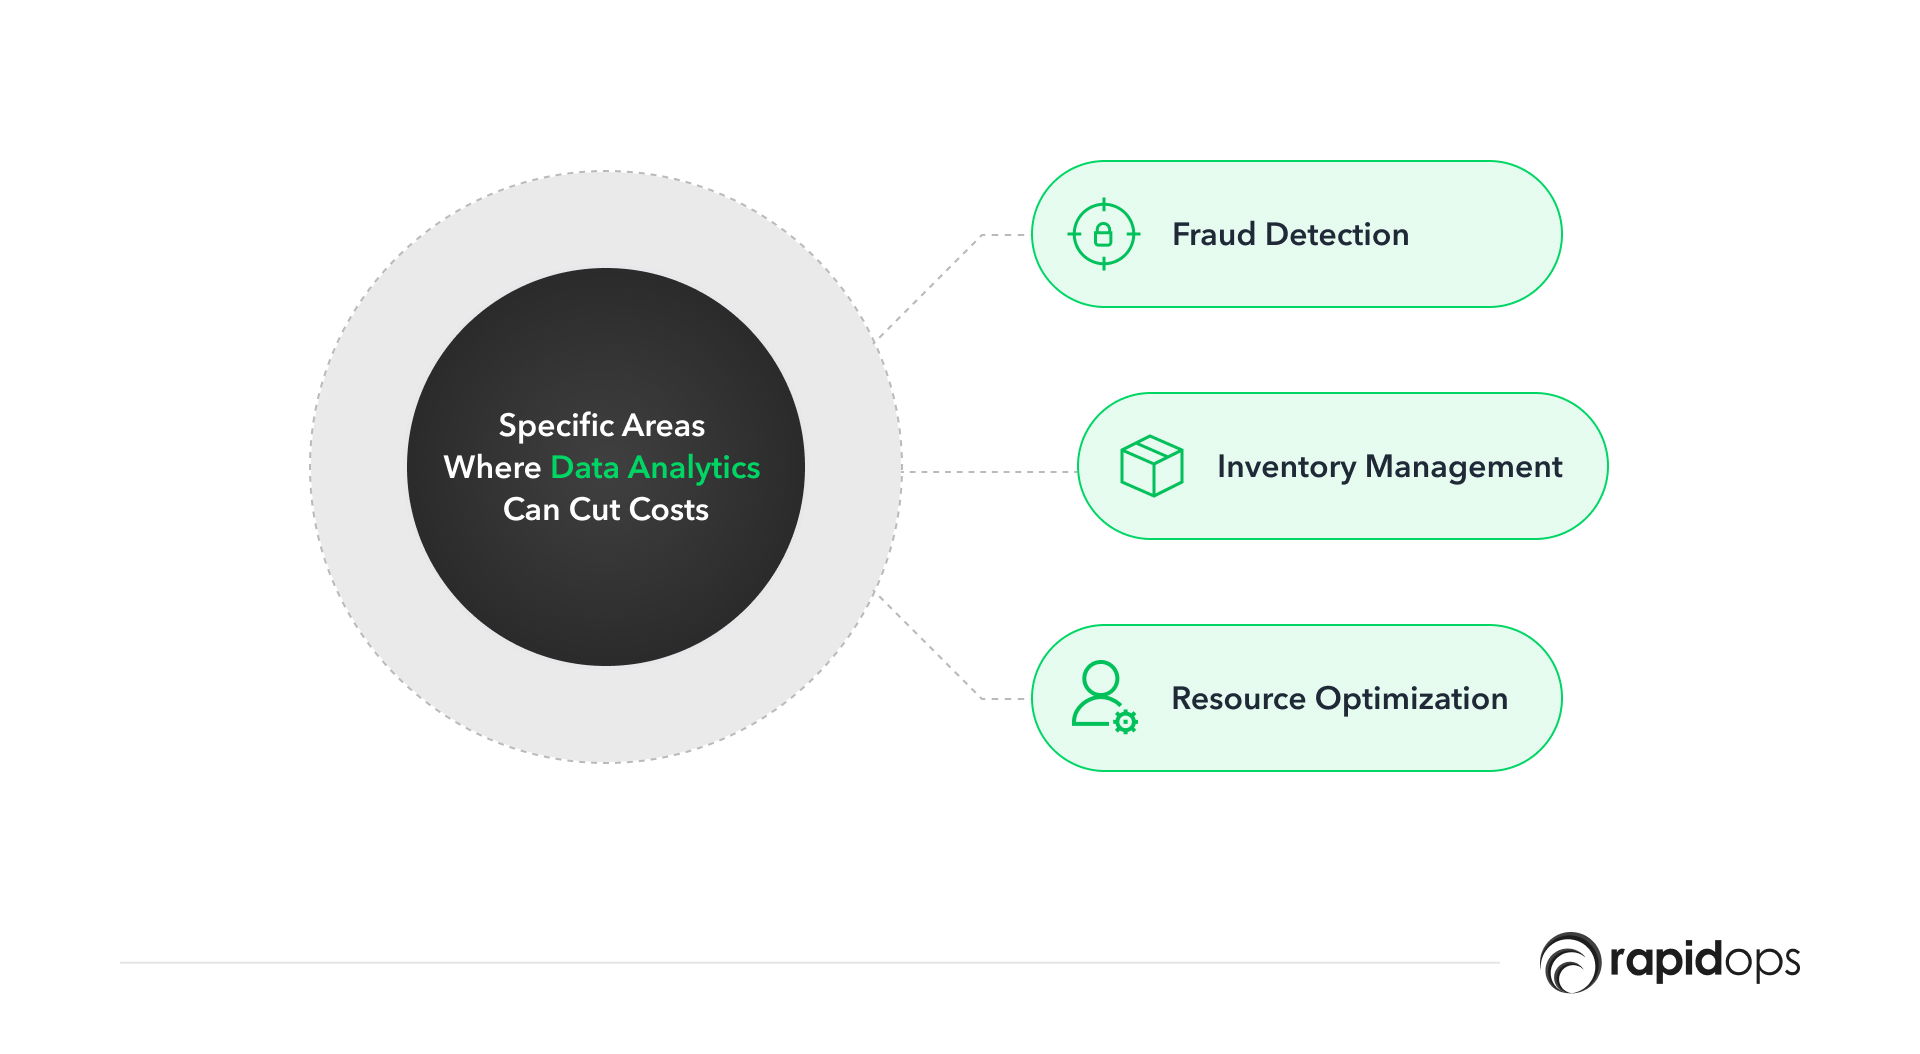
Data analytics offers businesses numerous ways to cut costs and improve financial efficiency.
Let's delve deeper into some specific areas where data analytics can make a significant impact:
1. Fraud detection
Fraud can be detrimental to a business's financial health and reputation. Data analytics can aid in fraud detection and prevention, safeguarding businesses from financial losses and protecting their brand image.
By analyzing transactional data and patterns, companies can identify anomalies and detect potential instances of fraud, such as credit card fraud or employee theft.
For example, financial institutions use data analytics to monitor customer transactions and identify suspicious activities.
By applying advanced analytics techniques, such as anomaly detection and predictive modeling, they can pinpoint irregular patterns indicative of fraudulent behavior.
Promptly detecting and preventing fraud saves money and preserves customer trust and confidence in the business.
2. Inventory management
Effective inventory management is crucial for businesses, as excessive stock or stockouts can result in financial losses.
By leveraging data analytics, companies can optimize their inventory management processes.
By analyzing sales data, businesses can gain insights into which products are selling well and which are not. This information enables them to make informed decisions regarding inventory levels and orders, ensuring they stock only high-demand products.
By avoiding overstocking or understocking, businesses can reduce carrying costs, minimize waste, and save money.
For example, a retailer using data analytics may identify seasonal trends or shifts in consumer preferences, allowing them to adjust their inventory levels accordingly.
By accurately predicting demand, they can optimize their supply chain and reduce the need for excessive inventory storage.
3. Resource optimization
Data analytics can be vital in optimizing resource usage, including labor, energy, and materials.
By analyzing operational data, businesses can identify inefficiencies and areas where resources could be utilized more effectively. This insight allows them to implement targeted strategies to optimize resource allocation, ultimately reducing costs.
For instance, data analytics can help identify bottlenecks in the production process, enabling businesses to streamline workflows and allocate labor resources more efficiently.
In addition, by identifying energy usage patterns, companies can implement energy-saving measures, such as adjusting equipment settings or optimizing production schedules, resulting in cost savings. Moreover, data analytics can uncover opportunities for material waste reduction, leading to improved cost-efficiency and sustainability.
Examples of businesses saving money with data analytics
The International Data Corporation (IDC) predicted worldwide spending on big data and analytics will reach $274.3 billion by 2022.
Numerous businesses have already achieved significant cost savings through data analytics. Here are some examples:
1. Delta Airlines
Delta Airlines, one of the world's largest airlines, has implemented data analytics to optimize fuel efficiency by not spending too many resources.
By analyzing data from various sources, including aircraft performance metrics, weather conditions, and flight routes, Delta Airlines can identify opportunities to minimize fuel consumption.
They use advanced algorithms to calculate the most fuel-efficient routes, adjust flight altitudes, and optimize aircraft weight. These data-driven strategies have helped Delta Airlines save millions of dollars in fuel costs annually.
2. Domino's Pizza
Domino's Pizza, a global pizza delivery chain, has used data analytics to enhance its operations for the same spent on resources.
As a result, Domino's can optimize its delivery routes and reduce delivery times by analyzing data from multiple sources, such as order volumes, traffic patterns, and customer locations.
In addition, they leverage data analytics to determine the most efficient delivery paths, assign orders to nearby drivers, and monitor real-time traffic conditions.
This data-driven approach has led to cost savings through improved fuel efficiency, reduced driver idle time, and enhanced overall delivery performance.
3. Procter & Gamble (P&G)
Procter & Gamble (P&G), a multinational consumer goods company, has leveraged data analytics to optimize their supply chain and inventory management processes.
By analyzing sales data, market trends, and customer preferences, P&G can accurately forecast product demand. This allows them to optimize their production and distribution processes, ensuring the right products are available at suitable locations and times.
By reducing excess inventory and minimizing stockouts, P&G has achieved substantial cost savings while improving customer satisfaction.
4. American Airlines
American Airlines, one of the largest airlines in the world, has harnessed data analytics to improve maintenance operations, which helped them cut costs on operations and utilize that corpus differently.
As a result, American Airlines can implement predictive maintenance strategies by analyzing data from aircraft sensors, maintenance logs, and historical performance data.
As a result, they can proactively identify and address potential maintenance issues before they escalate, minimizing downtime and reducing maintenance costs.
This data-driven approach has allowed American Airlines to optimize its maintenance schedules, enhance operational efficiency, and save significant aircraft maintenance and repair costs.
Data analytics tools and software
It would be best if you used specialized tools and software to implement data analytics in your business operations. Here are some popular options:
1. Microsoft Power BI
Microsoft Power BI is a business analytics tool that allows businesses to visualize and analyze data from various sources. It offers a user-friendly interface and a range of features, including data modeling, data analysis, and data visualization.
- Data-driven decision-making: Power BI enables businesses to consolidate and analyze data from multiple sources, providing a holistic view of operations. This data-driven decision-making approach helps identify cost-saving opportunities and optimize business processes.
- Budgeting and forecasting: Power BI's reporting and forecasting capabilities can assist in budgeting and financial planning. By accurately predicting future costs and revenue, businesses can align their resources and investments accordingly, minimizing financial risks and maximizing cost efficiency.
- Real-time monitoring: Power BI provides real-time dashboards and alerts, allowing businesses to monitor key metrics and promptly detect anomalies or cost overruns. This proactive approach helps identify cost-saving opportunities and enables timely corrective actions.
2. Tableau
Tableau is another popular business analytics tool that allows businesses to transform data into actionable insights. It offers a range of features, including data visualization, data analysis, and real-time data collaboration.
- Improved decision-making: Tableau enables businesses to gain valuable insights from their data and make informed decisions. This can lead to better resource allocation, identification of cost-saving opportunities, and optimization of operations.
- Waste reduction: By analyzing data, businesses can identify areas where waste occurs and take corrective actions. For example, analyzing production data can reveal inefficiencies, enabling companies to optimize processes and minimize wasteful practices.
- Identifying cost drivers: Tableau's data exploration capabilities help identify cost drivers within the business. By visualizing data related to expenses, revenue, and other vital metrics, companies can pinpoint areas where costs are high and implement strategies to reduce them.
3. Google Analytics
Google Analytics is a free web analytics service that allows businesses to track website traffic and user behavior. It offers a range of features, including audience insights, conversion tracking, and real-time reporting.
- Cost-effective marketing campaigns: Businesses can optimize their marketing efforts by analyzing data on user behavior, acquisition channels, and campaign performance. This allows for more targeted and cost-effective campaigns, reducing unnecessary marketing expenditures.
- Website optimization: Google Analytics provides insights into user behavior, helping identify areas where user experience can be improved. By enhancing website usability and conversion rates, businesses can reduce bounce rates, increase sales, and ultimately minimize costs per customer acquisition.
- Measurement of ROI: Google Analytics enables businesses to track the return on investment (ROI) for various marketing activities. By evaluating the performance of different campaigns and channels, companies can allocate their resources more effectively and focus on strategies that yield the highest ROI.
Implementing data analytics in your business operations
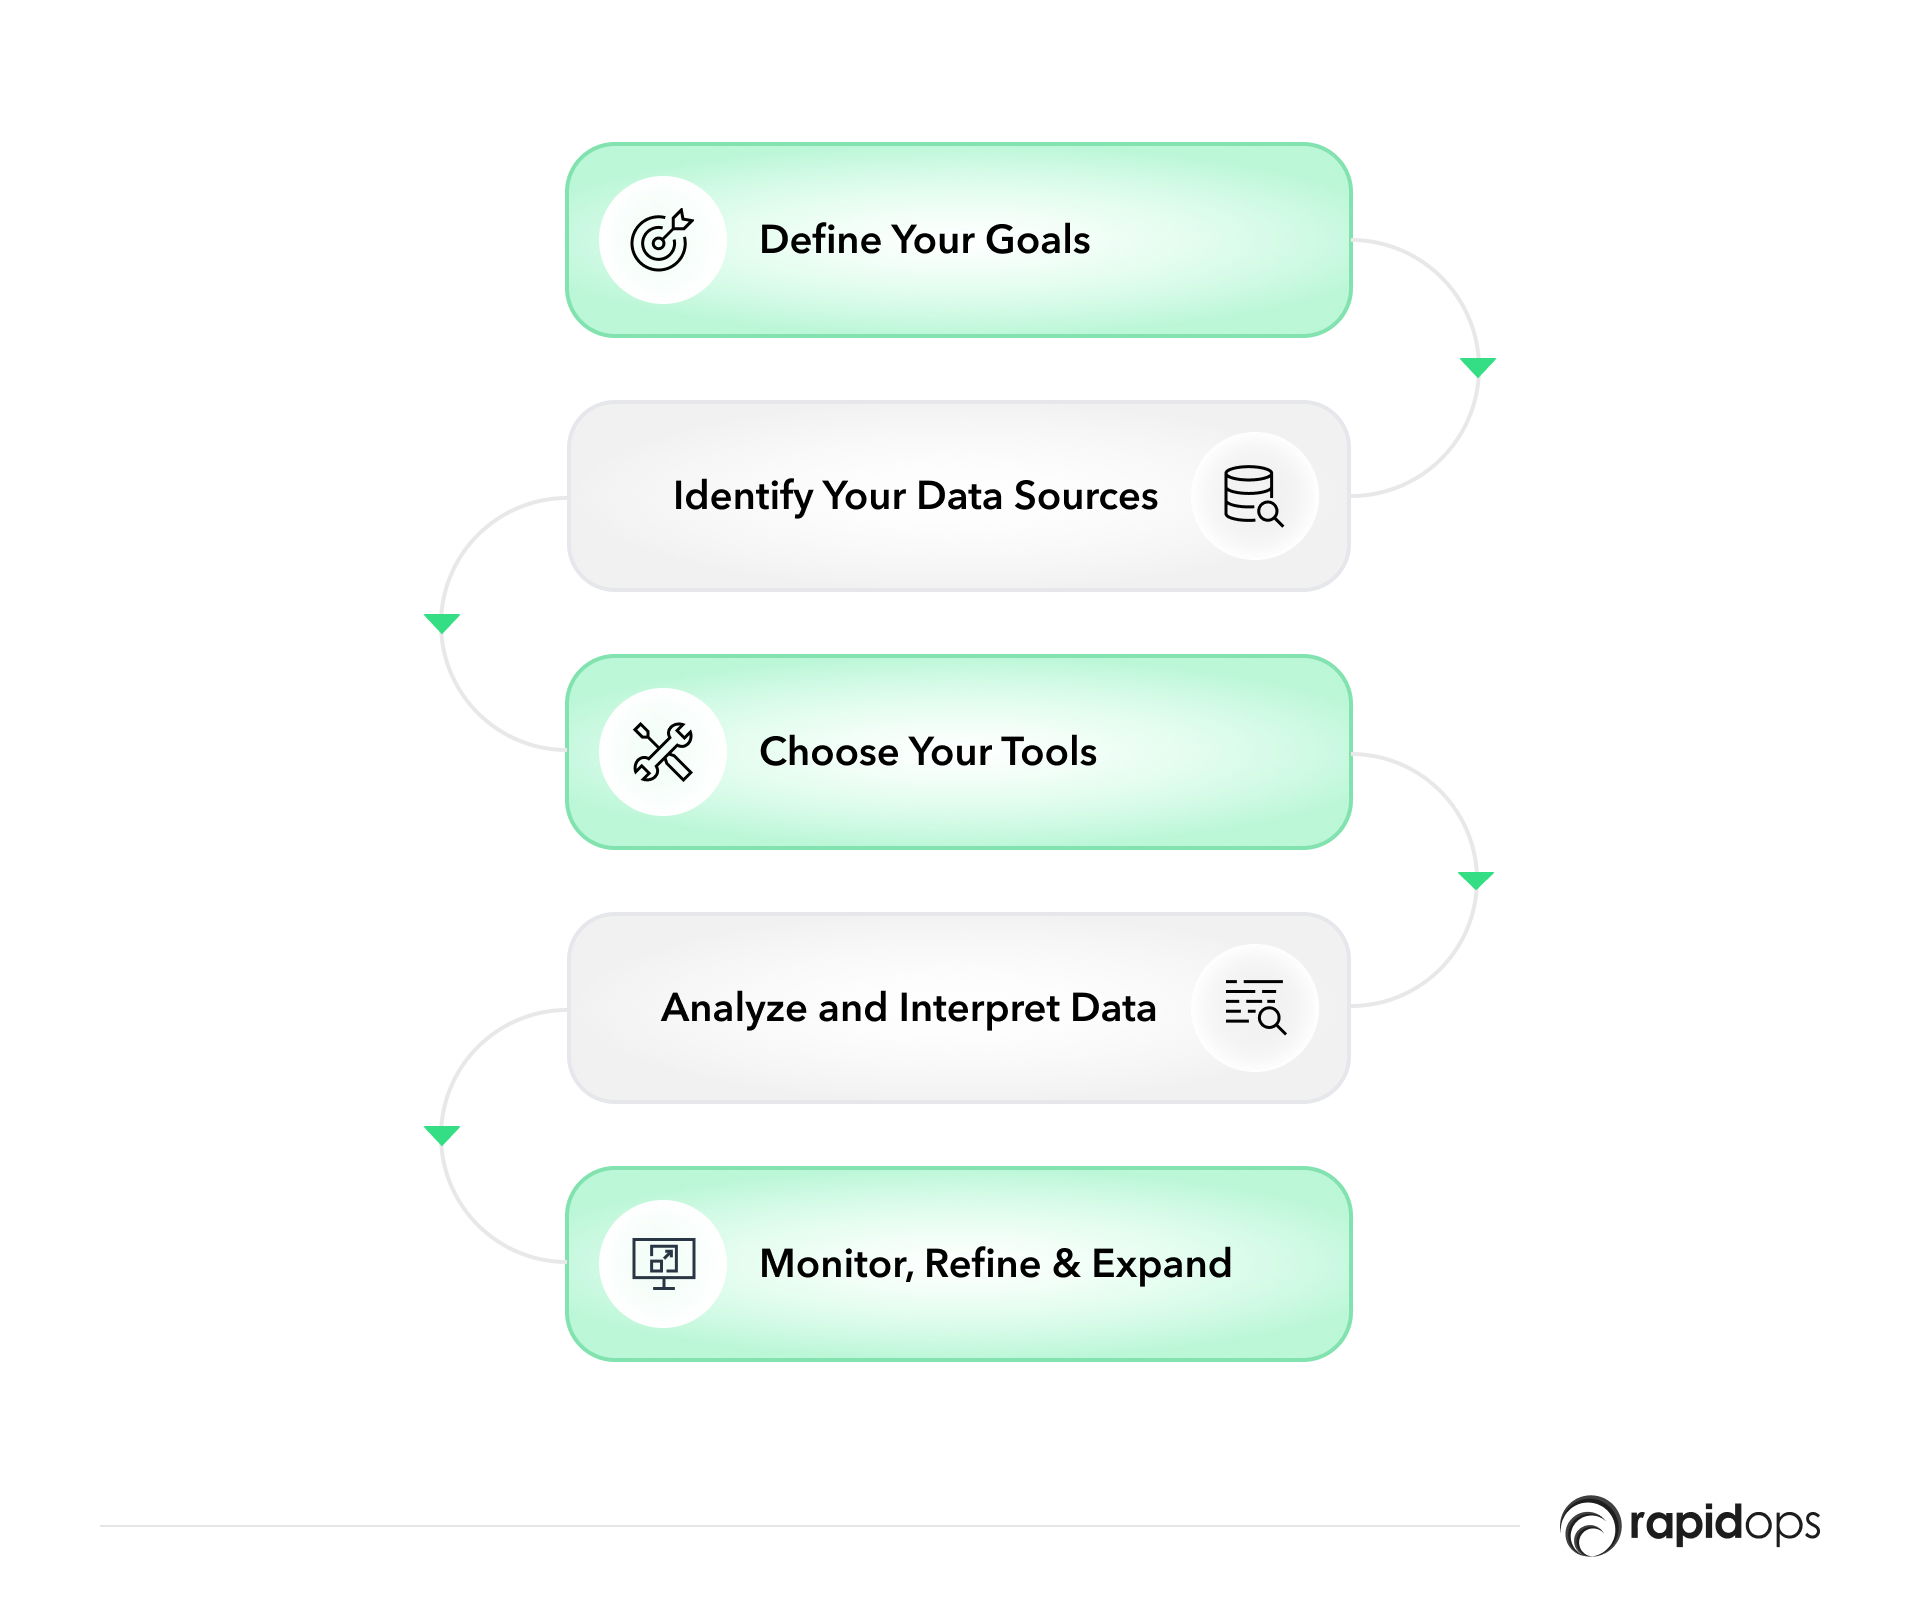
Data analytics can transform your business, but the process must start correctly. This section provides a step-by-step guide to implementing data analytics effectively, ensuring you maximize efficiency and cost savings from the outset.
Step 1: Define your goals
Clearly articulate what you hope to achieve with data analytics. Whether improving customer satisfaction, reducing operational costs, or enhancing product quality, setting clear objectives will guide your data strategy and help measure success. Consider using SMART goals (Specific, Measurable, Achievable, Relevant, Time-bound) to structure your objectives better.
Step 2: Identify your data sources
An effective data analytics initiative relies on diverse and comprehensive data inputs. Identify all potential data sources that align with your objectives, such as customer interactions, financial transactions, and operational metrics. The broader your data collection, the deeper your insights can be. Ensure data quality from the start to avoid garbage-in and garbage-out scenarios.
Step 3: Choose your tools
Choose analytics tools that fit your business size, industry, and data types. Tools should be robust, scalable, and user-friendly to ensure they are accessible to your team. Consider tools that integrate easily with your existing systems and have strong support and community engagement. If that's not the case, you can always opt for bespoke software development!
Step 4: Analyze and interpret data
With your tools and the data at hand, begin the analysis. Look for patterns and trends that align with your business objectives. It’s not just about having data but making it actionable. Employ visualizations to help disseminate these insights across your team, making it easier for everyone to understand and make data-driven decisions.
Step 5: Monitor, refine, and expand
Data analytics is not a set-and-forget process. Review the outcomes regularly against your defined objectives. Use these insights to refine your approach continually and explore new data avenues. As your business and the external environment evolve, so should your analytics practices to stay relevant and effective.
Challenges and considerations in data analytics implementation
While data analytics offers significant opportunities for business transformation, its implementation is not without challenges. Awareness of these potential obstacles is the first step toward mitigating them effectively.
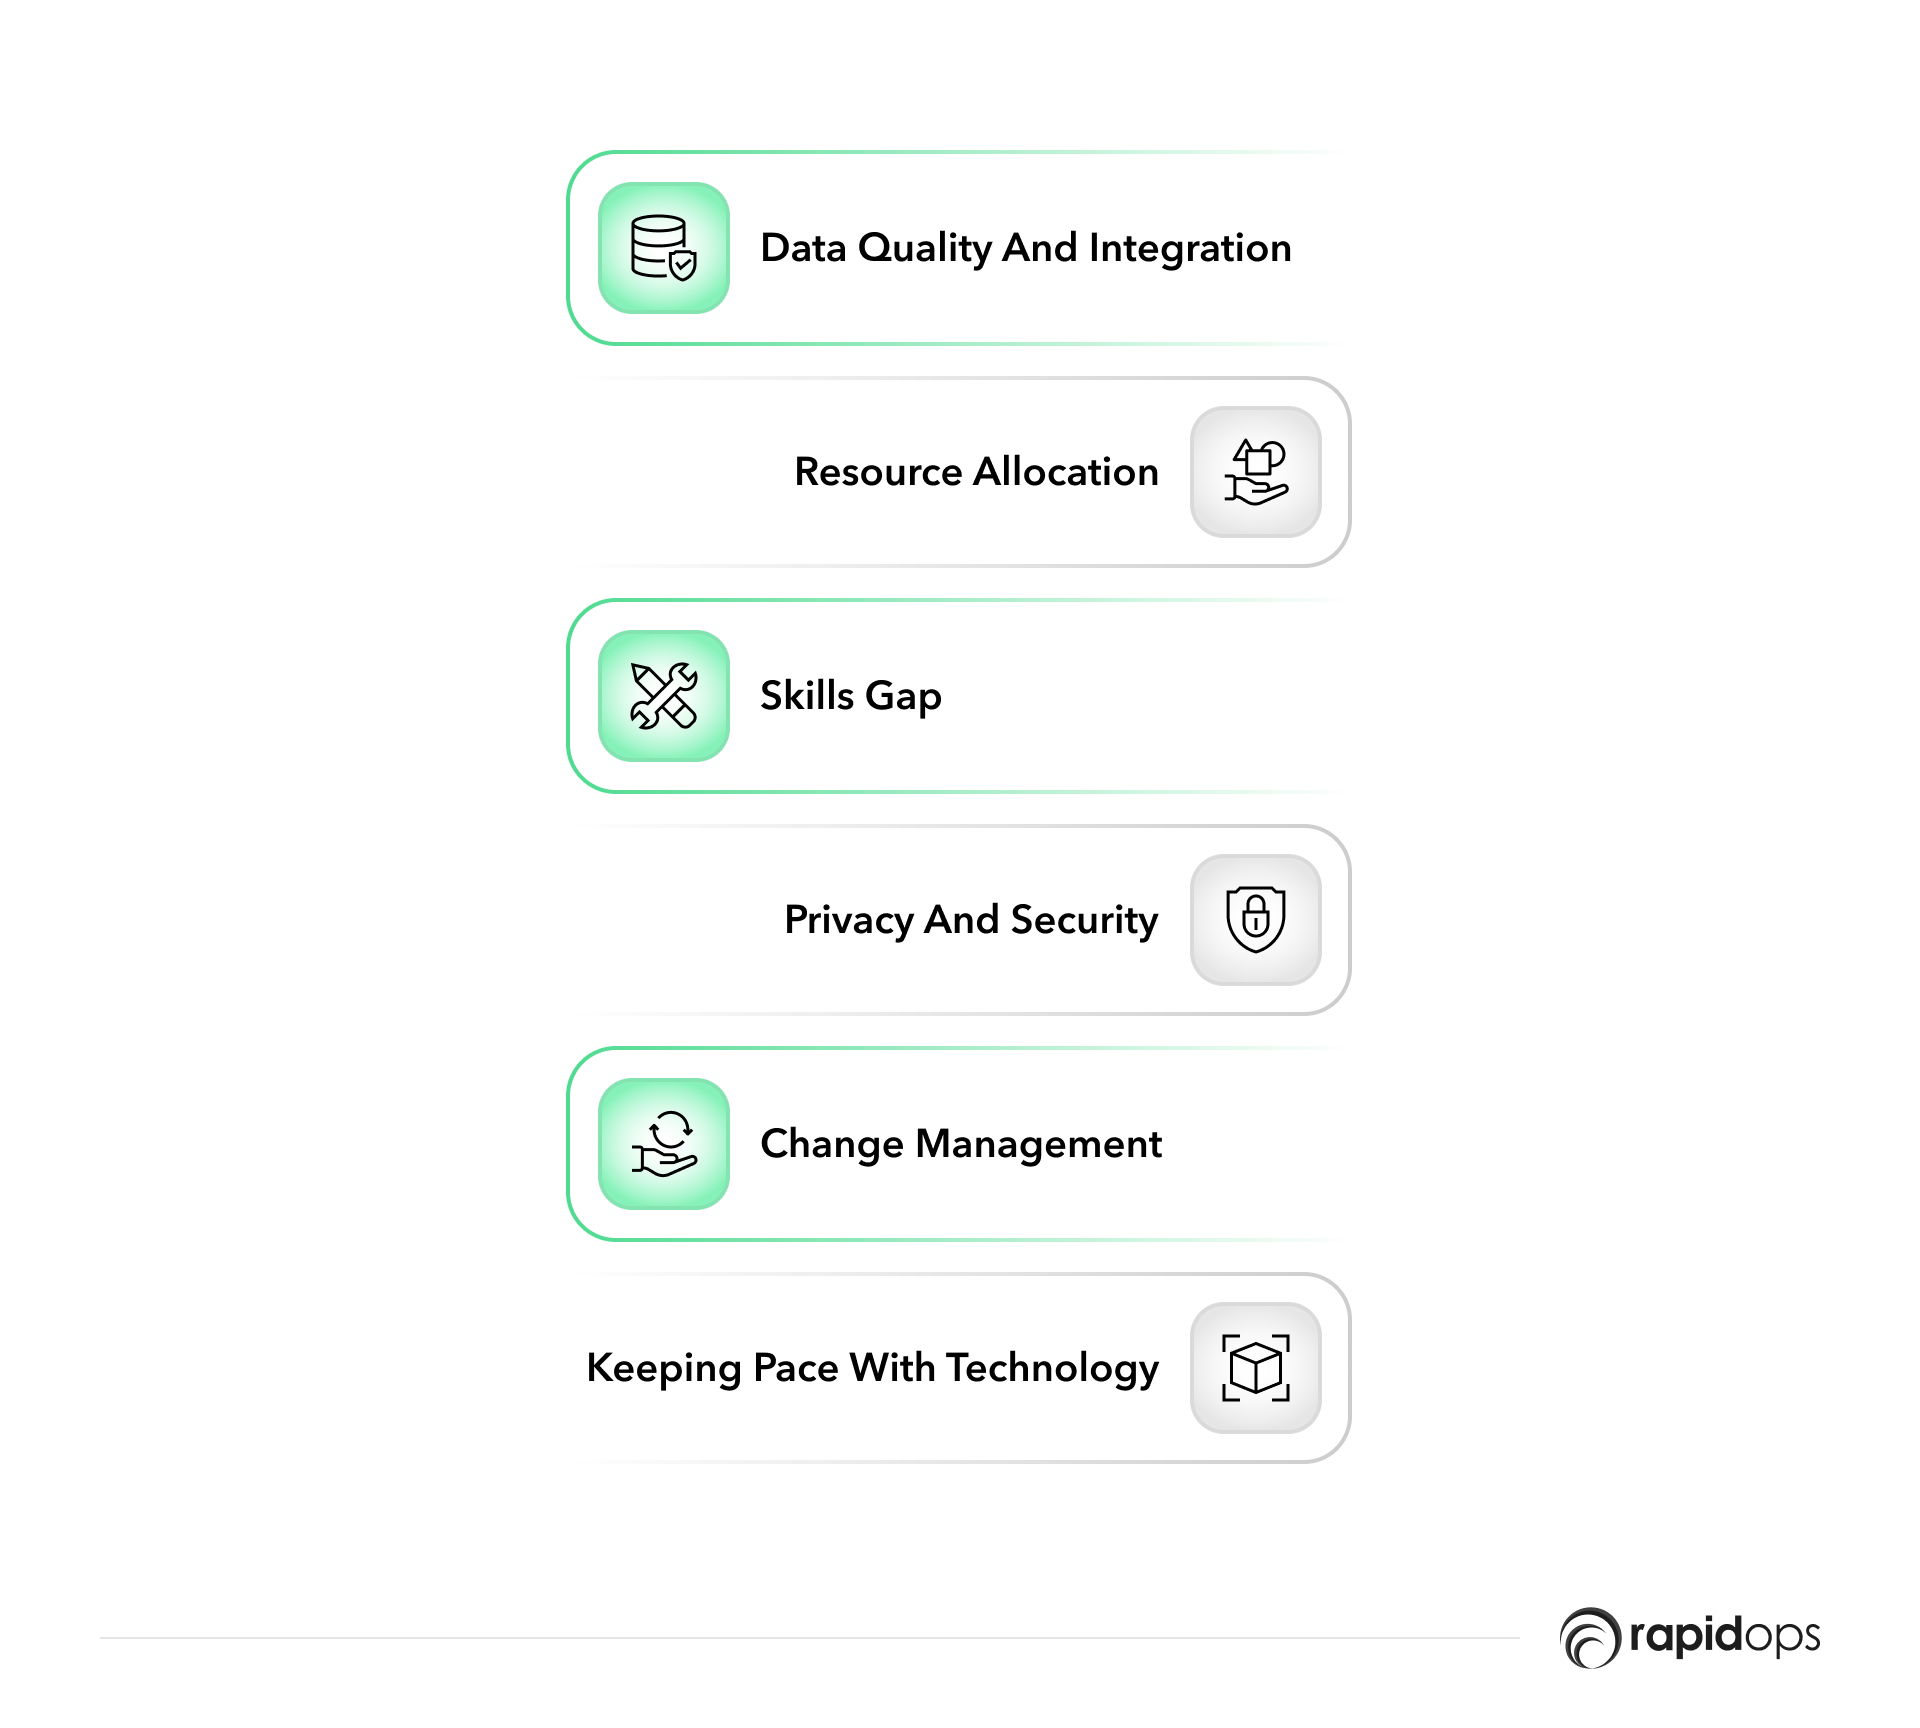
1. Data quality and integration
- Challenge: Ensuring data quality and integrating disparate data sources can be daunting. Poor data quality or inconsistent data can lead to inaccurate analyses and misguided business decisions. Our experience in logistics highlights the importance of robust data management practices.
- Consideration: Invest in robust data management practices. Implementing standardized data collection procedures and regular data quality checks can safeguard against these issues.
2. Resource allocation
- Challenge: Allocating the right resources, including budget and personnel, can be challenging, especially for organizations new to data analytics.
- Consideration: Start small with pilot projects to demonstrate value before scaling. This approach allows for manageable investments and provides a clearer picture of the resource requirements.
3. Skills gap
- Challenge: A significant skills gap often acts as a barrier to effective implementation. Having team members who understand the technical and business sides of data analytics is crucial.
- Consideration: To fill these gaps, consider training existing employees, recruiting new talent, or partnering with educational institutions. Continuous learning and development are key.
4. Privacy and security
- Challenge: Data breaches and privacy concerns can undermine trust in data analytics initiatives.
- Consideration: Adhering to regulatory requirements and best practices in data security must be a priority. Regular audits and updates to security protocols are essential to maintain data integrity and confidentiality.
5. Change management
- Challenge: Resistance to change is common, as data analytics can significantly alter established business processes.
- Consideration: Effective change management strategies, including clear communication, stakeholder engagement, and phased implementation, can ease the transition.
6. Staying updated with technology
- Challenge: The rapid pace of technological advancement can make it difficult to keep up with the latest developments in data analytics.
- Consideration: Stay informed about industry trends and updates. Regular training sessions and attending relevant workshops and seminars can help you stay current.
How does hiring a data analytics professional or consulting firm help optimize cost?
If you do not have the resources or expertise to implement data analytics in-house, you may consider hiring a data analytics professional or team. Here are some factors to consider when hiring:
- Experience and expertise: Look for candidates with experience and expertise in data analytics and related fields. If not, then hire an external firm to help you solve the skilled resources problem.
- Cost and budget: Consider the cost of hiring a data analytics professional or team and ensure that it fits within your budget.
- Communication skills: Choose candidates with excellent communication skills to ensure that they can effectively communicate insights and recommendations to your team.
Conclusion
The Retail Analytics Council reported that retailers using data analytics experienced an average 10% reduction in costs and a 10% increase in revenue.
Businesses can uncover hidden cost-saving opportunities by leveraging tools' data visualization and analysis capabilities.
They can identify inefficiencies, optimize processes, and make data-driven decisions that improve resource allocation and reduce costs.
However, it's important to note that successfully implementing and utilizing these data analytics tools often requires expertise and guidance.
Collaborating with a trusted partner can help organizations navigate the complexities of these tools, ensure seamless integration, and maximize their impact on cost-reduction efforts.
If your business aims to cut operational costs and drive long-term success through data analytics, consider working with a knowledgeable partner who can guide you through the process and help you unlock the full potential of these powerful tools.

What’s Inside
- Introduction to data analytics
- Benefits of data analytics for businesses
- Harnessing data analytics for industry-specific advantages
- A leading US manufacturer used data analytics to drive cost reduction successfully
- Specific areas where data analytics can cut costs
- Examples of businesses saving money with data analytics
- Data analytics tools and software
- Implementing data analytics in your business operations
- Challenges and considerations in data analytics implementation
- How does hiring a data analytics professional or consulting firm help optimize cost?
- Conclusion

Let’s build the next big thing!
Share your ideas and vision with us to explore your digital opportunities
Similar Stories
- Analytics
- undefined Mins
- July 2019


Receive articles like this in your mailbox
Sign up to get weekly insights & inspiration in your inbox.