

In the fast-paced world of digital transformation, it's easy to get caught up in the buzz of agile teams, cloud migrations, and shiny new dashboards. The promise of transformation feels tangible. But as time passes and the data floods in, a critical question emerges: Are we truly moving the needle?
For CIOs and transformation leaders, tracking metrics is essential, but it’s not just about the numbers. The challenge lies in identifying which metrics will genuinely reflect progress and drive impactful decisions.
As research from MIT reveals, focusing on the wrong KPIs can derail even the most well-funded transformation initiatives. With an overwhelming array of data points, many organizations end up measuring too much and, in the process, lose sight of what matters most.
To ensure your digital transformation isn't just a series of fleeting trends, you need the right foundation. In this article, we'll explore the 10 key metrics that matter most in assessing the success of your digital transformation.
These metrics are designed to align with your business goals and deliver tangible outcomes, guiding you to make informed decisions that drive real impact. Let’s uncover the metrics that will truly steer your transformation forward.
Establishing a strategic foundation before defining metrics
Prior to defining digital transformation metrics, it’s essential to establish a solid strategic foundation. Success hinges on having clear business goals, a unified vision, and strong alignment across teams.
Without this groundwork, metrics may become disconnected from the organization’s true objectives, resulting in superficial tracking that fails to drive meaningful change. Once you define success, align teams, and clarify goals, you can confidently move forward in measuring progress and evaluating impact.
1. Define what success means for your organization
Before you start selecting metrics, take the time to define success in clear, actionable terms. This means aligning your digital transformation goals with the organization’s broader strategic vision.
Ask yourself:
- What is the desired outcome of this transformation?
- Is it improving operational efficiency?
- Expanding into new markets?
- Enhancing customer experience through digital innovation?
A clear definition of success will not only ensure alignment across leadership teams but will also prevent the temptation to focus on vanity metrics, those that look good on paper but don’t drive actual business outcomes.
By setting concrete, measurable success criteria, you create a common understanding of what the transformation should achieve and how it will be measured in the future.
2. Ground your measurement approach in business goals
Once success is defined, the next step is to ground your measurement approach in the organization’s core business goals.
Every metric you establish should stem directly from these priorities. This ensures that your transformation efforts are aligned with the business’s most pressing objectives, whether that’s growth, efficiency, innovation, or customer impact.
For example:
- Growth: Market expansion, increased digital revenue streams, or higher customer lifetime value.
- Operational efficiency: Streamlined processes, reduced cost-to-serve, or automation.
- Customer impact: Improvements in customer satisfaction, digital engagement, or retention.
These goals will guide your digital transformation journey and form the foundation for the metrics you define in the next stage. By aligning your metrics with business goals, you ensure they are meaningful, actionable, and directly tied to your success.
3. Foster alignment across teams
It’s critical that your teams are aligned on the vision and business goals before you begin measuring progress.
This alignment ensures that all departments are working towards the same objectives, preventing fragmented efforts and confusion along the way.
Leadership should clearly communicate the transformation goals across the organization, ensuring everyone understands how their efforts contribute to the broader vision.
Establishing this alignment upfront also helps create ownership and accountability at all levels, fostering a culture where each team knows their role in achieving the organization’s strategic goals.
4. Prepare for metrics that matter
Once you’ve defined success, grounded it in business goals, and aligned your teams, you are ready to move into the next phase of defining your digital transformation metrics.
These metrics will be the key indicators of whether or not your transformation is on track to achieve the desired outcomes.
But remember, the metrics you set should be tailored to support the overarching strategic objectives you’ve already established.
With this strategic foundation in place, you can now transition into defining and implementing specific metrics that will measure progress, guide decisions, and ultimately drive meaningful change for your organization.
10 key metrics to measure digital transformation progress
Tracking progress in digital transformation requires more than surface-level data, it demands precision.
The right digital transformation metrics reveal whether your initiatives are truly driving change, creating value, and aligning with your strategic goals. Here are 10 key metrics that offer clear, actionable insight into your transformation journey.
1. Digital revenue contribution
Digital revenue contribution reveals how much business growth comes from online channels, showing the true impact of your digital ecosystem.
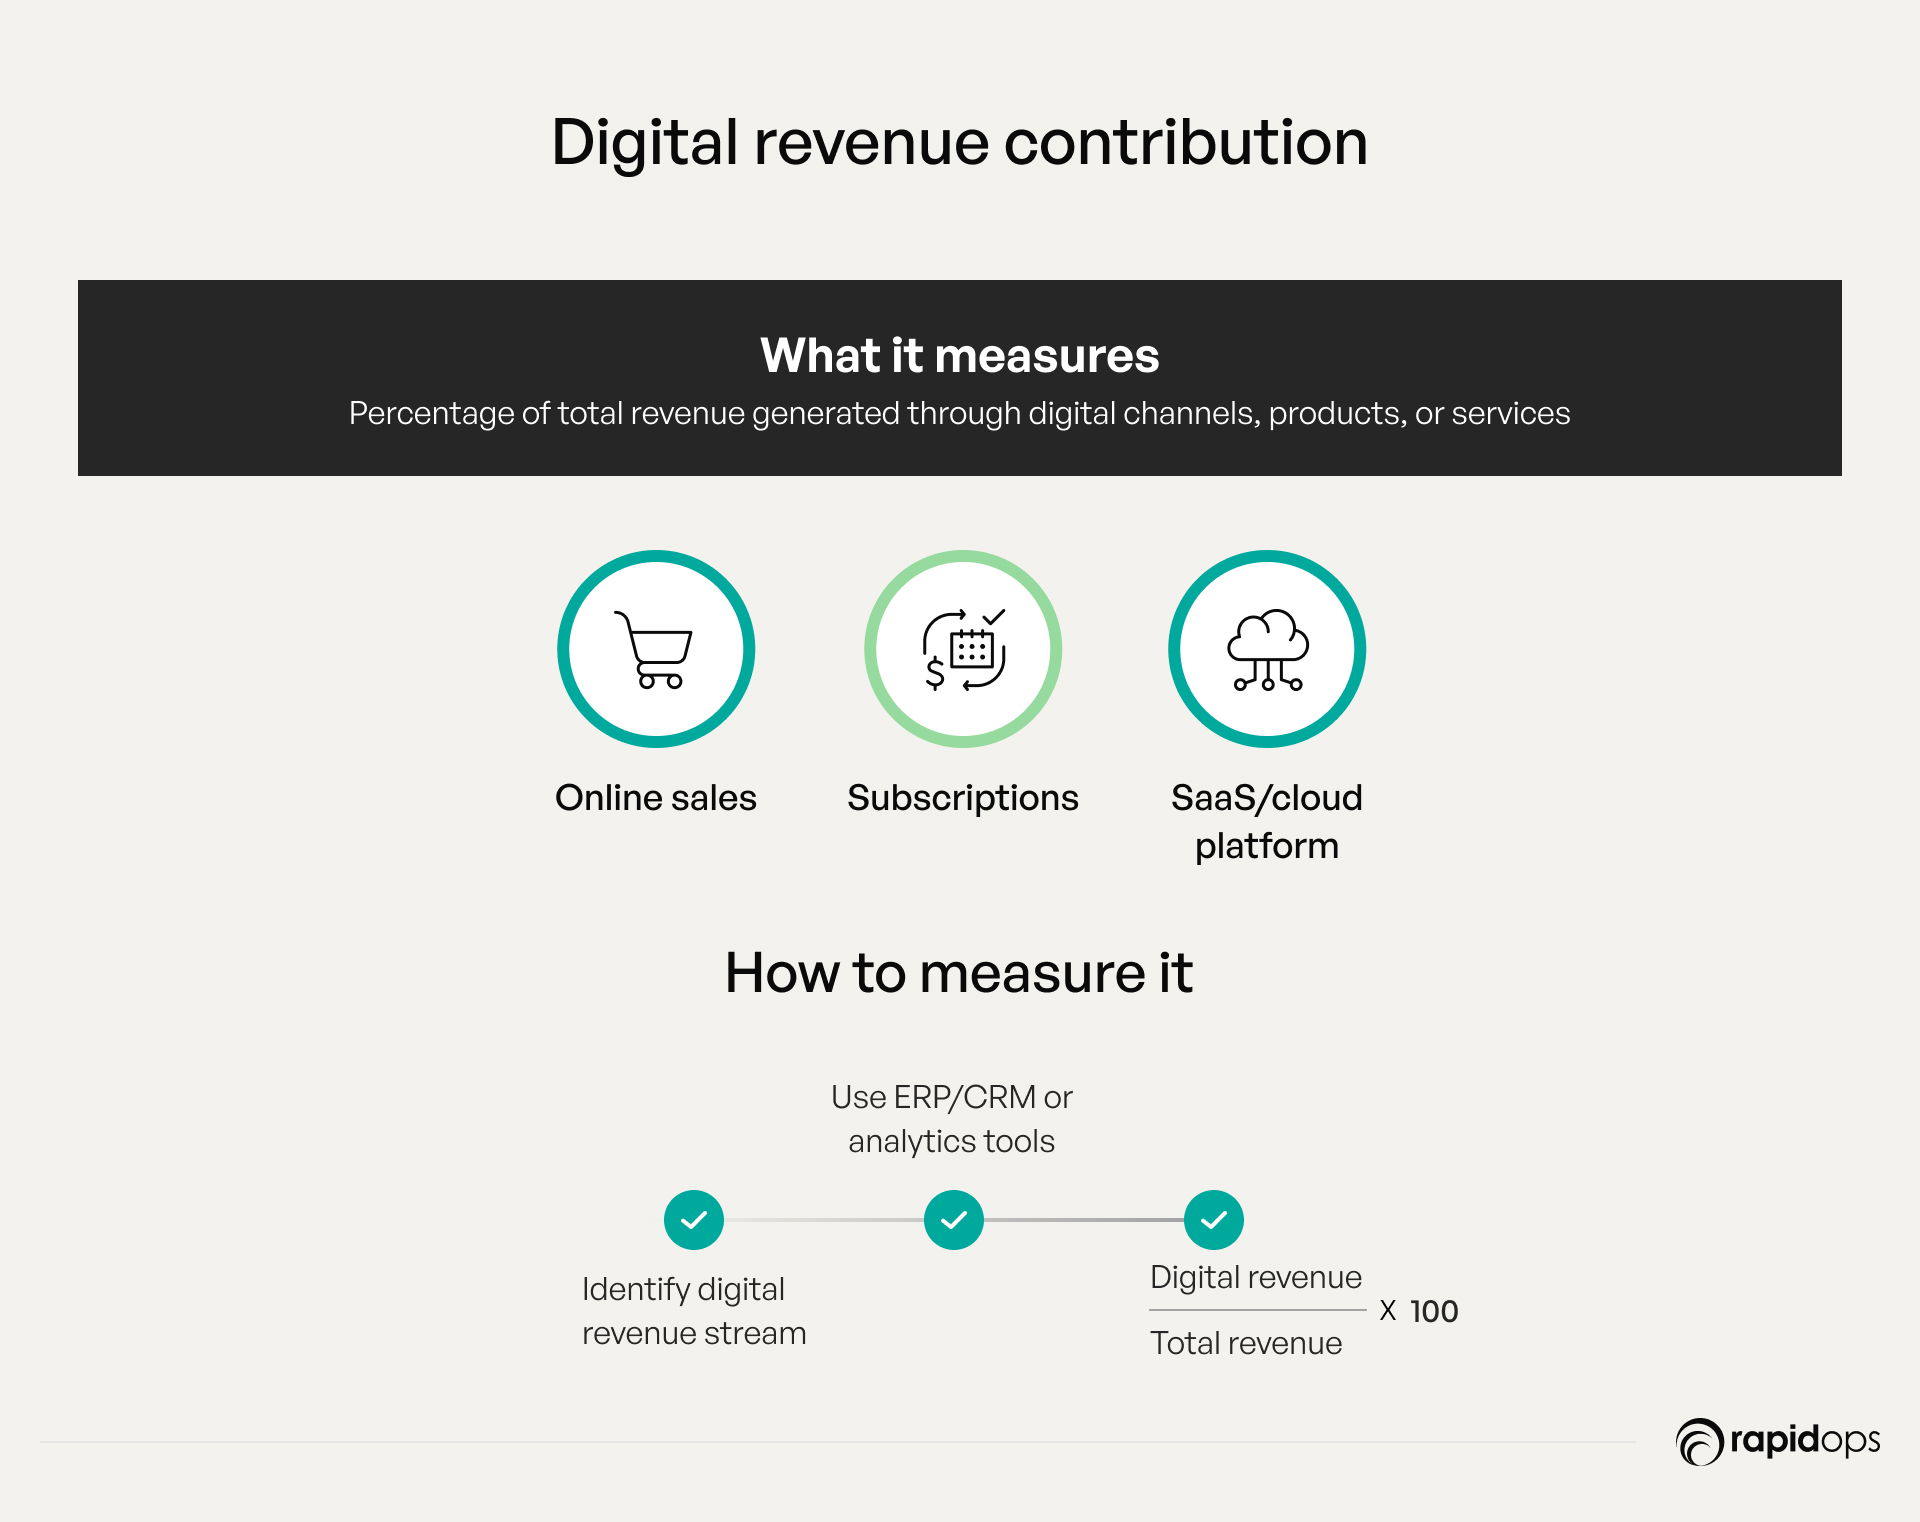
What it measures
The digital revenue contribution metric measures the percentage of total revenue generated through digital channels, products, or services.
This includes online sales, digital subscriptions, and other revenue streams directly linked to digital initiatives.
This metric is crucial for assessing the tangible impact of digital transformation efforts, indicating how effectively a company has integrated digital strategies into its revenue-generating activities.
Why it matters
This metric reflects how effectively digital transformation is driving business growth.
A higher contribution indicates that digital channels are becoming core revenue drivers, signaling a successful shift toward a digitally enabled business model.
It serves as a key indicator of how well customer engagement, innovation, and operational efficiencies are translating into financial success through digital means.
How to measure it
To measure digital revenue contribution, follow these steps:
- Identify digital revenue sources: Clearly define what constitutes digital revenue, such as e-commerce sales, digital subscriptions, and SaaS revenue.
- Use analytics platforms: Utilize ERP and CRM systems to track and isolate digital revenue. Digital analytics tools, such as Google Analytics, can help track digital sales or transactions, providing insights into revenue generated through online channels.
- Track and compare: Consistently track digital revenue over time and compare it against total revenue. This will enable you to view the percentage of your revenue generated from digital channels, providing a clear understanding of your business's digital performance.
How to track progress over time
- Track quarterly and yearly: Regularly assess digital revenue contribution on a quarterly and yearly basis to gauge short-term and long-term growth.
- Set targets: Establish targets for digital revenue contribution as part of your broader digital strategy. Track these goals over time to monitor progress.
- Benchmarking: Compare your digital revenue contribution with industry averages or those of your competitors to assess your performance relative to the market.
2. Return on digital investment (RODI)
In the digital era, every initiative carries the potential to shape growth, efficiency, and customer impact, RODI helps you see the true payoff of those efforts.
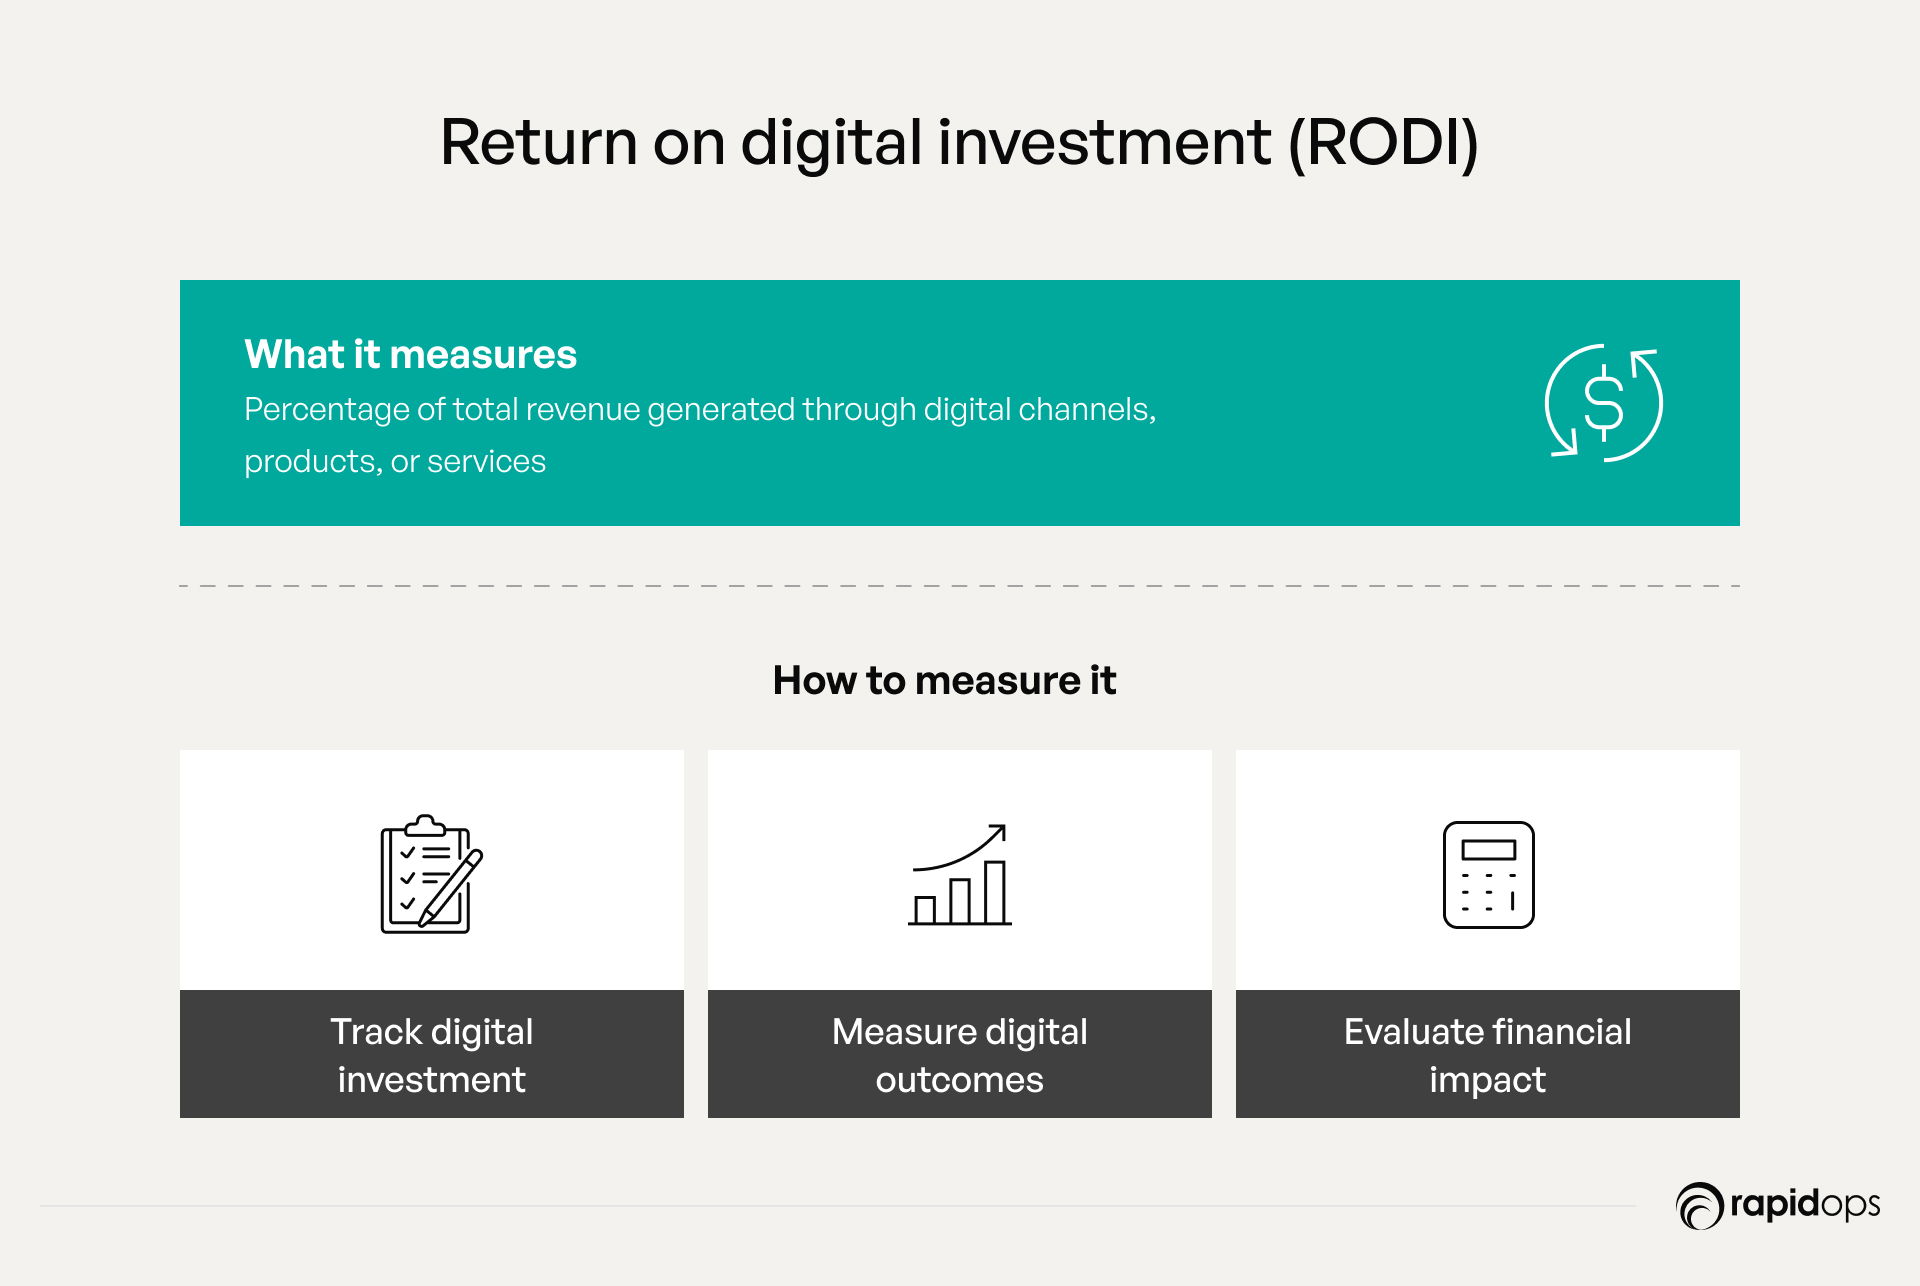
What it measures
Return on digital investment (RODI) measures the financial return derived specifically from investments in digital transformation efforts.
This metric focuses on how digital initiatives, such as new technologies, digital platforms, or process optimizations, contribute to tangible business outcomes, including revenue generation, cost savings, or increased operational efficiency.
Why it matters
RODI ensures that digital investments deliver measurable value. It helps prioritize high-impact projects, justifies ongoing spending, and aligns digital initiatives with financial goals, ultimately optimizing returns through data-driven decision-making.
How to measure it
- Track digital investments: Identify all expenses related to digital transformation, such as technology acquisition, platform subscriptions, software development, and training costs.
- Measure digital outcomes: Assess the direct financial impact of these investments by examining improvements in revenue, cost reductions, or operational efficiency resulting from digital initiatives.
- Evaluate the financial impact: Quantify how these digital investments have contributed to growth in areas such as sales, customer retention, and productivity, ensuring that these results are tied back to specific digital initiatives.
How to track progress over time
- Regular tracking: Monitor RODI at regular intervals (quarterly, semi-annually, or annually) to capture both immediate returns and the compounding effects of long-term digital investments.
- Set benchmarks: Use historical data or predefined targets to compare current RODI and assess whether digital investments are meeting or exceeding expectations.
- Optimize and adjust: Continuously evaluate the effectiveness of digital projects to ensure optimal performance. Utilize RODI insights to prioritize the most profitable initiatives, refine strategies, and allocate resources where the returns are highest.
This approach allows organizations to ensure they are achieving a high return on their digital investments, justifying future spending, and continuously improving their digital transformation strategies.
3. Digital adoption rate
The digital adoption rate reflects how seamlessly people adopt and integrate new technologies into their daily workflows, signaling the pace of transformation within your organization.
What it measures
The digital adoption rate measures the extent to which employees, partners, and customers engage with and utilize digital tools, systems, and platforms within an organization.
This could include ERP systems, CRM software, mobile apps, or any other digital platforms critical to operations.
High adoption rates signify that your digital transformation initiatives are gaining traction and acceptance among users, a key sign of progress in digital transformation.
Why it matters
Digital adoption is a crucial metric for evaluating the effectiveness of digital transformation.
It serves as a leading indicator of user acceptance, signaling whether digital tools and platforms are driving value for users, which in turn drives business outcomes.
A high adoption rate is indicative of successful training, integration, and user alignment, while low rates can reveal friction points in the user experience, training gaps, or inadequate communication.
Understanding digital adoption can help organizations tailor their transformation efforts to maximize value and minimize resistance.
How to measure it
To track digital adoption rate, follow these steps:
- Identify intended users: Clearly define the pool of users who should be engaging with the digital tools, whether that’s internal teams, external partners, or customers.
- Track active users: Utilize digital tracking tools within platforms (such as ERP, CRM, or mobile apps) to regularly measure the number of active users accessing and interacting with the systems.
- Assess user engagement: Gauge user activity based on their frequency and depth of interactions. The higher the number of active users compared to the intended user pool, the more successful the adoption.
- Data sources: Leverage platform analytics, CRM, ERP, or custom reporting dashboards that provide user activity data. These tools enable segmentation by various user types (e.g., employees vs. customers) for more granular insights.
How to track progress over time
- Short-term tracking: During the initial rollout phase, monitor monthly to assess early adoption and identify issues in user engagement or system integration.
- Long-term tracking: Once the platform is fully deployed, track adoption on a quarterly basis to gauge ongoing usage patterns and identify any continuous improvements or emerging barriers to full adoption.
- Benchmarking: Establish clear benchmarks based on industry standards or internal goals for adoption rates, adjusting strategies if the metric falls short of expectations.
4. Operational efficiency gains from digital tools
Operational efficiency gains from digital tools highlight how technology streamlines processes, reduces friction, and enables teams to achieve more with less effort.
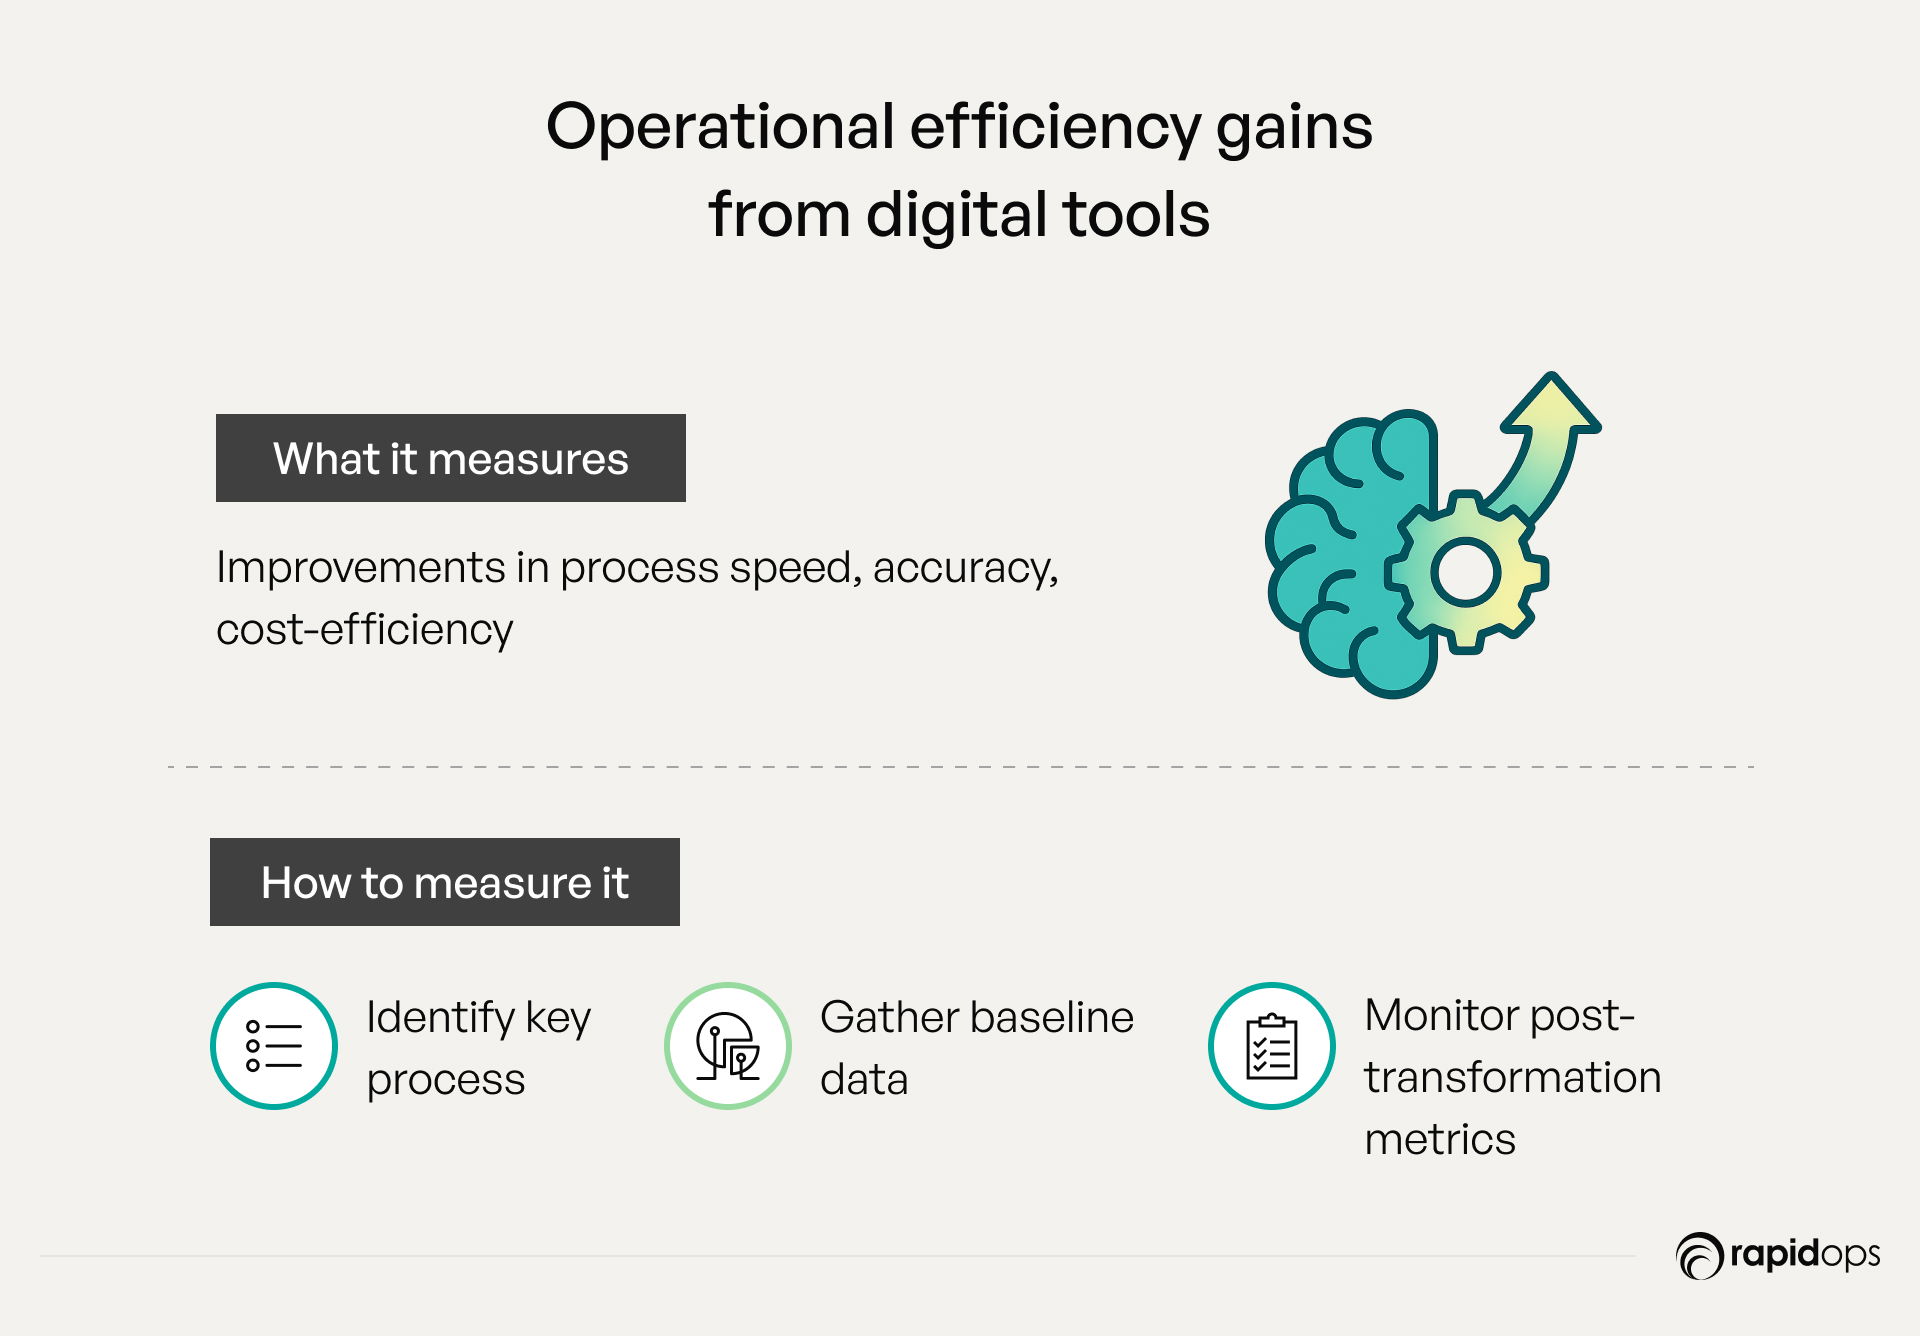
What it measures
Operational efficiency gains from digital tools track the improvements in business processes driven by the adoption of digital technologies.
These digital transformation metrics capture enhancements in process speed, accuracy, and cost-efficiency due to the implementation of digital solutions.
By measuring these improvements, businesses can assess how effectively their digital transformation efforts are optimizing workflows and resource use, helping them operate at a lower cost and faster speed.
Why it matters
Operational efficiency is a key metric in digital transformation, directly impacting profitability and competitiveness.
By optimizing speed, accuracy, and cost efficiency through digital tools, businesses reduce waste, increase throughput, and enhance productivity.
This leads to better customer satisfaction, streamlined processes, and lower costs, strengthening the competitive edge and supporting strategic goals.
How to measure it
To measure operational efficiency gains, follow these steps:
- Identify key processes: Focus on critical processes that are directly impacted by digital tools. These could be customer service operations, supply chain management, or financial transactions.
- Gather baseline data: Collect pre-transformation data on cycle times, cost per transaction, error rates, and other relevant metrics before implementing digital solutions.
- Monitor post-transformation metrics: After deploying digital tools, track the same metrics to identify improvements. For example, compare the average cycle time or error rates before and after the implementation of automation tools or digital collaboration platforms.
- Data sources: Use process analytics from ERP, CRM, or workflow management tools to gather data for comparison. Many digital platforms provide built-in reports that can easily track these key metrics.
How to track progress over time
- Short-term tracking: Track efficiency gains monthly during the initial post-transformation period to quickly identify any improvements or roadblocks in process optimization.
- Long-term tracking: After the initial phase, monitor progress quarterly to assess sustained improvements and identify areas for further optimization.
- Benchmarking: Compare your operational efficiency against industry standards or internal targets to gauge how competitive and effective your digital transformation efforts have been.
5. Time to market for digital products or features
Time to market gauges how quickly new digital products or features move from concept to launch, reflecting an organization’s agility and innovation speed.
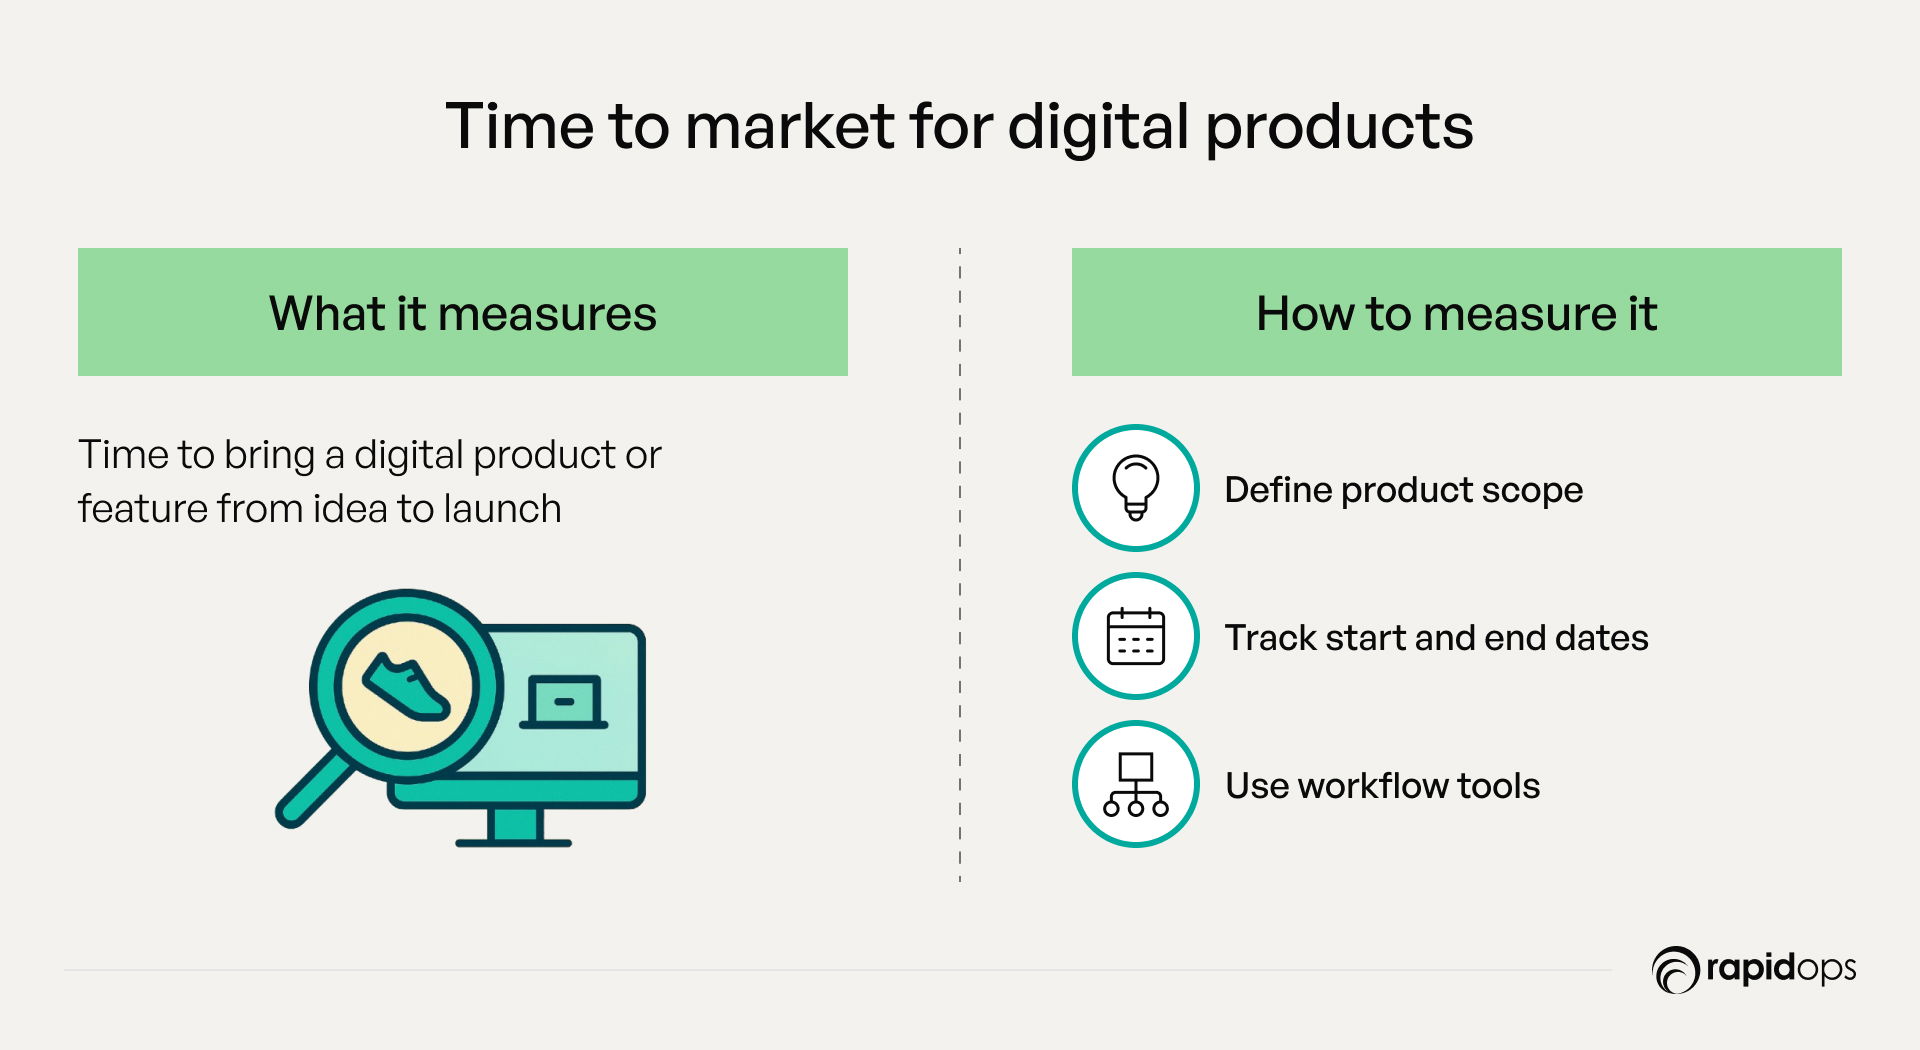
What it measures
Time to market for digital products or features captures how quickly a business can translate an approved idea into a live, customer-facing solution.
This metric reflects an organization’s ability to execute digital innovation efficiently spanning product ideation, design, development, and deployment.
As one of the critical digital transformation metrics, it directly reveals an enterprise’s digital agility and operational readiness to respond to market shifts or customer needs.
Why it matters
Speed is a competitive differentiator in the digital economy. A shorter time to market signals high digital maturity, efficient cross-functional collaboration, and strong technology foundations such as DevOps, agile workflows, or low-code platforms.
This digital progress metric demonstrates how quickly a company can meet customer expectations, seize new opportunities, and iterate based on market feedback, ultimately enhancing both customer experience and revenue growth.
How to measure it
To measure time to market effectively:
- Define the scope: Establish what qualifies as a digital product or feature, this could include mobile apps, platform enhancements, new APIs, or AI-driven services.
- Set clear start and end points: Typically, this means tracking the number of business days from concept approval (not ideation) to production deployment or launch.
- Leverage digital workflow tools: Use product management platforms like Jira, Azure DevOps, or internal PMO systems to extract timestamps from digital delivery pipelines.
Standardize measurement practices across teams to ensure consistent tracking and meaningful comparisons over time.
How to track progress over time
- Per release tracking: Monitor the time to market for each new digital release or feature rollout. This enables immediate visibility into delivery efficiency.
- Trend analysis: Review performance quarterly or biannually to identify acceleration or delays in the delivery lifecycle.
- Compare against baselines: Track improvements by comparing current release speeds against historical averages or industry benchmarks. Over time, this helps signal maturing capabilities in innovation velocity and product delivery.
6. Percentage of processes digitized
Percentage of processes digitized measures how much of your operations have transitioned from manual to digital workflows, showcasing the depth of technological integration.
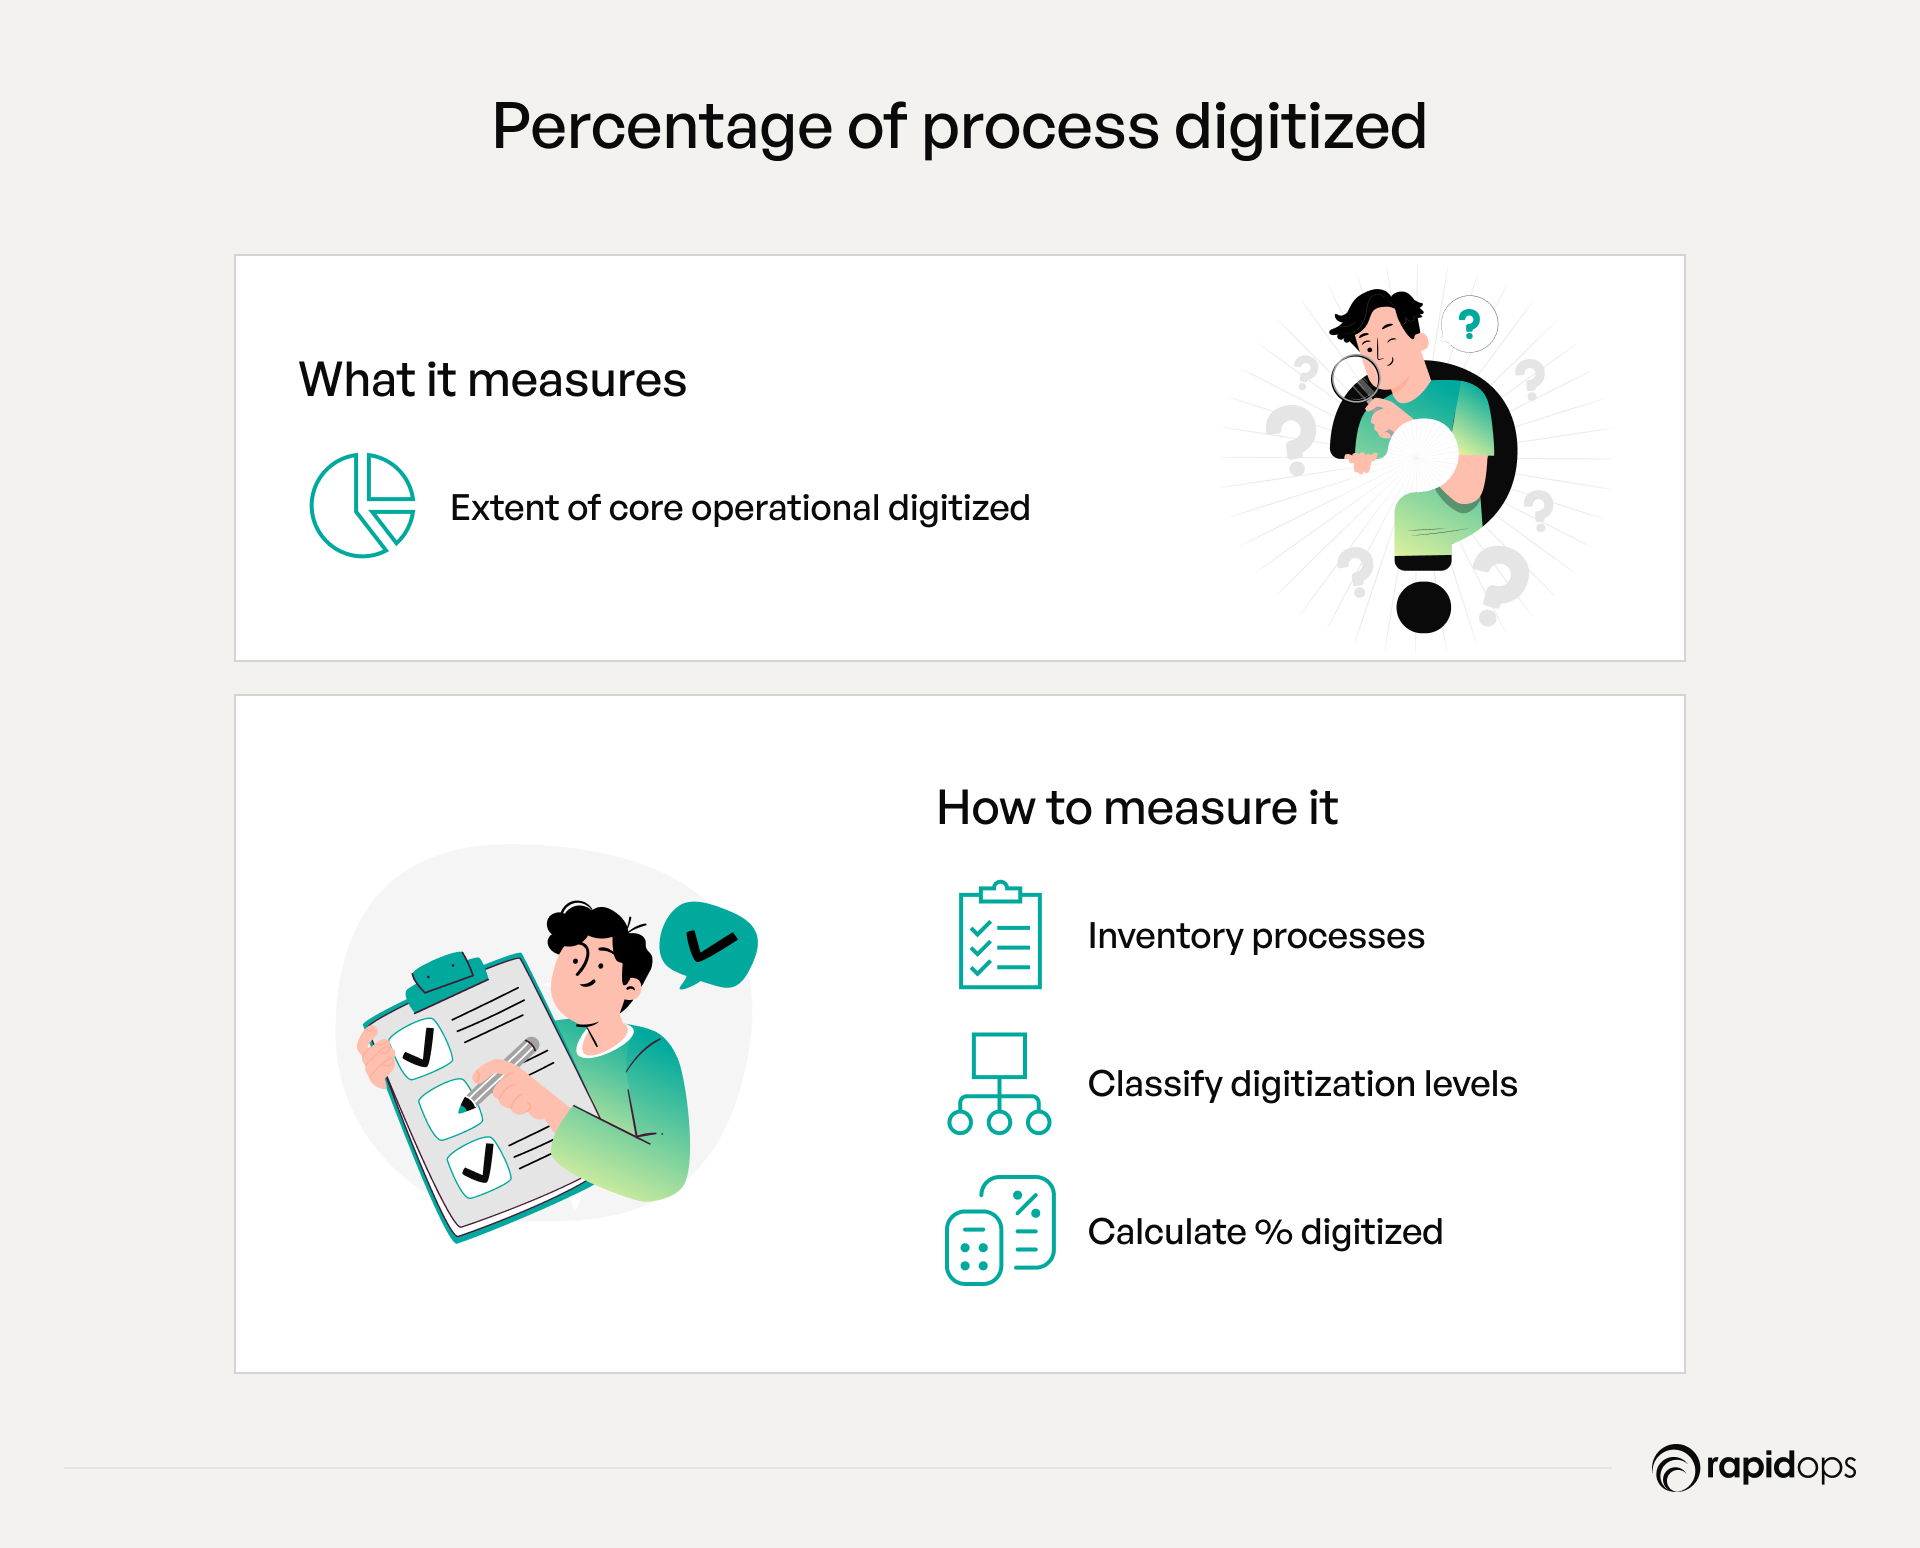
What it measures
The percentage of processes digitized reflects how much of an organization’s core operations have been transitioned from manual or analog workflows to digital or automated systems.
As a key digital transformation metric, it highlights the breadth of digital integration across departments, covering functions such as finance, HR, supply chain, and customer service.
This metric goes beyond individual tools to assess how deeply digital capabilities are embedded in day-to-day execution.
Why it matters
This metric serves as a barometer for digital maturity and internal alignment.
A higher percentage signals greater automation, consistency, and scalability, enabling improved operational efficiency, enhanced employee productivity, and better data governance.
It’s also a leading indicator of how well-positioned a business is to respond to change, reduce costs, and deliver consistent customer experiences across touchpoints.
How to measure it
To accurately measure this digital transformation metrics:
- Inventory core business processes: Start by mapping out end-to-end processes across departments, prioritize high-impact or high-volume activities.
- Classify digitization levels: Determine whether each process is fully digitized, partially digitized (e.g., a mix of manual and digital steps), or entirely manual.
- Assess enablement through systems: Validate digitization using platforms such as ERP, CRM, RPA tools, or workflow automation solutions.
- Calculate digitization rate: The number of fully or partially digitized processes divided by the total number of identified core processes gives the digitization percentage.
How to track progress over time
- Audit quarterly or biannually: Conduct structured reviews to track newly digitized workflows and retirement of legacy/manual steps.
- Stage-based benchmarks: Align tracking with stages of digital maturity for example, moving from basic automation to full AI-powered decision-making.
- Monitor transformation velocity: Use this metric to measure the pace at which digital transformation is scaling internally, enabling proactive resourcing and prioritization.
7. Digital customer experience score (or Digital NPS)
Digital customer experience score captures how customers perceive their interactions with your digital channels, providing actionable insights to elevate satisfaction, loyalty, and long-term engagement.
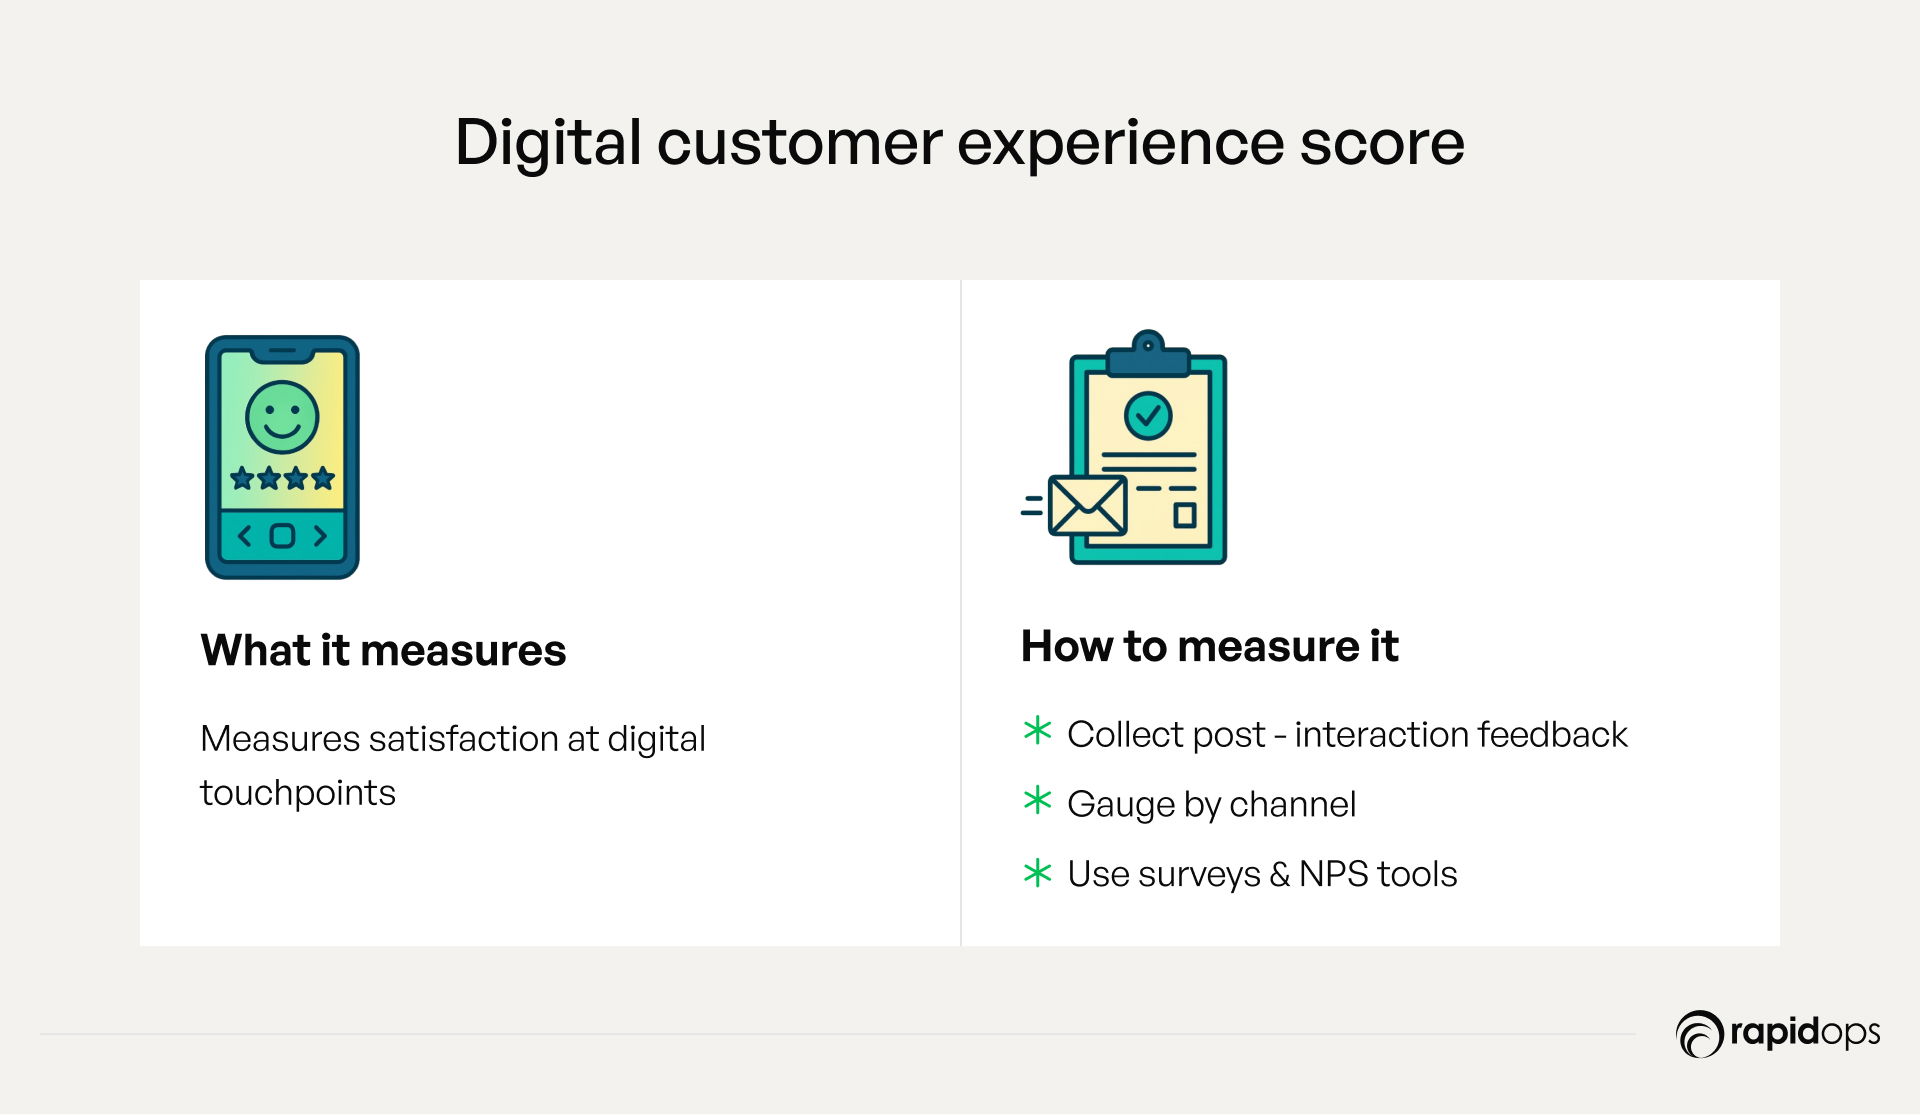
What it measures
The digital customer experience Score (often captured through digital net promoter score or post-interaction feedback) quantifies customer satisfaction specifically within digital touchpoints, such as websites, mobile apps, chatbots, or online portals.
As a focused digital transformation metrics, it isolates customer sentiment in digital environments, offering a precise view of how well your transformation efforts are delivering seamless, intuitive, and value-driven experiences.
Why it matters
This metric serves as a direct reflection of how your digital interfaces impact customer trust, loyalty, and satisfaction.
A consistently strong digital NPS signals that your digital experiences are meeting expectations in areas like usability, responsiveness, personalization, and support.
As such, it's a critical indicator of customer experience excellence, brand competitiveness, and ROI in digital transformation, especially in a landscape where digital-first engagement is the norm.
How to measure it
To accurately assess this digital progress metric:
- Deploy post-interaction surveys: Trigger feedback requests after key digital interactions, completing a purchase, engaging with a chatbot, or using a self-service portal.
- Isolate channel-specific scores: Measure customer sentiment separately for each channel (e.g., website vs. app) to identify performance gaps.
- Use structured tools: Platforms like Medallia, Qualtrics, or in-app survey tools help capture real-time NPS and qualitative feedback.
- Segment responses: Analyze scores by user type, device, or behavior to uncover actionable insights and tailor future improvements.
How to track progress over time
- Monitor quarterly trends: Track changes over time to evaluate how UX improvements or new features influence satisfaction.
- Correlate with CX initiatives: Use the metric to assess which digital investments are driving the biggest gains in customer perception.
- Benchmark regularly: Compare against historical averages and industry standards to evaluate competitiveness and transformation success.
8. Innovation and digital ecosystem expansion
Innovation and digital ecosystem expansion reflect how your organization leverages technology partnerships, platforms, and tools to create new offerings and stay ahead in the market.
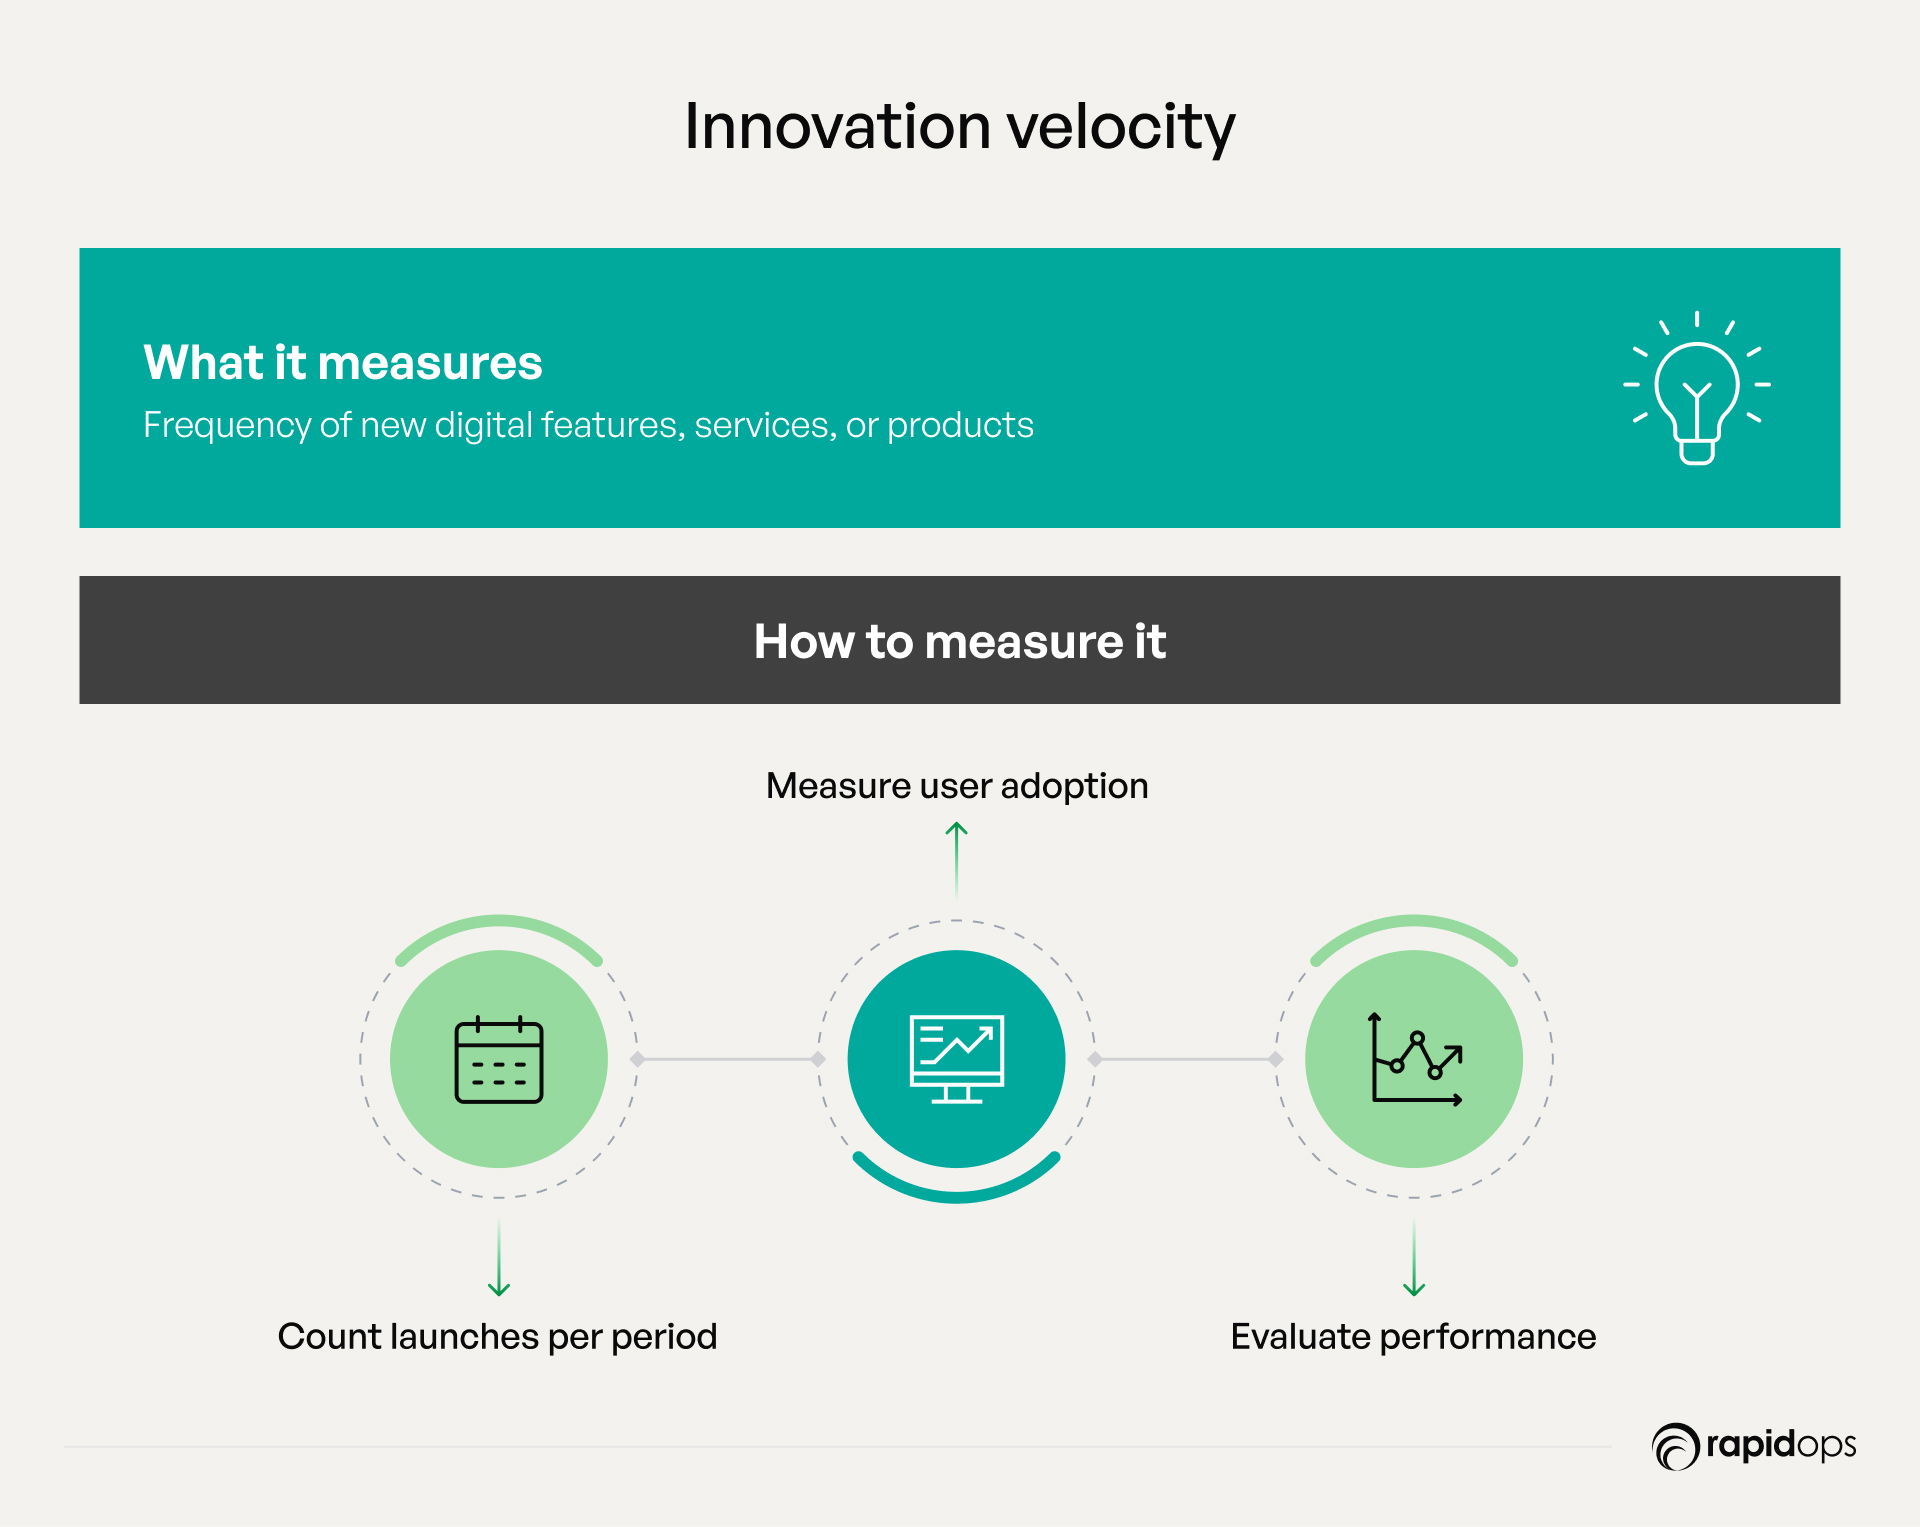
What it measures
Innovation Velocity captures how frequently and successfully an organization introduces new digital features, services, or products.
It evaluates both the rate of digital innovation and the real-world impact, such as how well those innovations are adopted by users.
This metric provides a forward-looking view of how effectively a company is evolving in response to changing market demands and digital opportunities.
Why it matters
A high innovation velocity is a hallmark of digital maturity. It signals a culture where experimentation, agility, and value creation are embedded into core operations. For leadership, this is not just about speed, it's about ensuring that innovation is purposeful, user-validated, and tied to strategic outcomes.
Tracking innovation velocity helps organizations stay competitive and responsive, ensuring digital transformation remains a living, iterative process rather than a one-time project.
How to measure it
To assess this digital transformation metric effectively:
- Count digital launches per period: Track the number of new features, services, or product iterations released each quarter.
- Measure adoption and engagement: Analyze the number of users who engage with the innovation within the first 30–60 days of its launch.
- Monitor rollout success: Evaluate performance using metrics like user satisfaction, usage frequency, and system stability post-launch.
- Gather internal feedback: Include input from product, engineering, and customer-facing teams to assess innovation bottlenecks or enablers.
How to track progress over time
- Use rolling averages: Monitor on a quarterly or biannual basis to smooth out anomalies and observe trends.
- Benchmark against internal targets: Set innovation KPIs by product line or business unit and evaluate consistency.
- Correlate with business outcomes: Link this metric to ROI, customer satisfaction, or operational efficiency to validate transformation effectiveness.
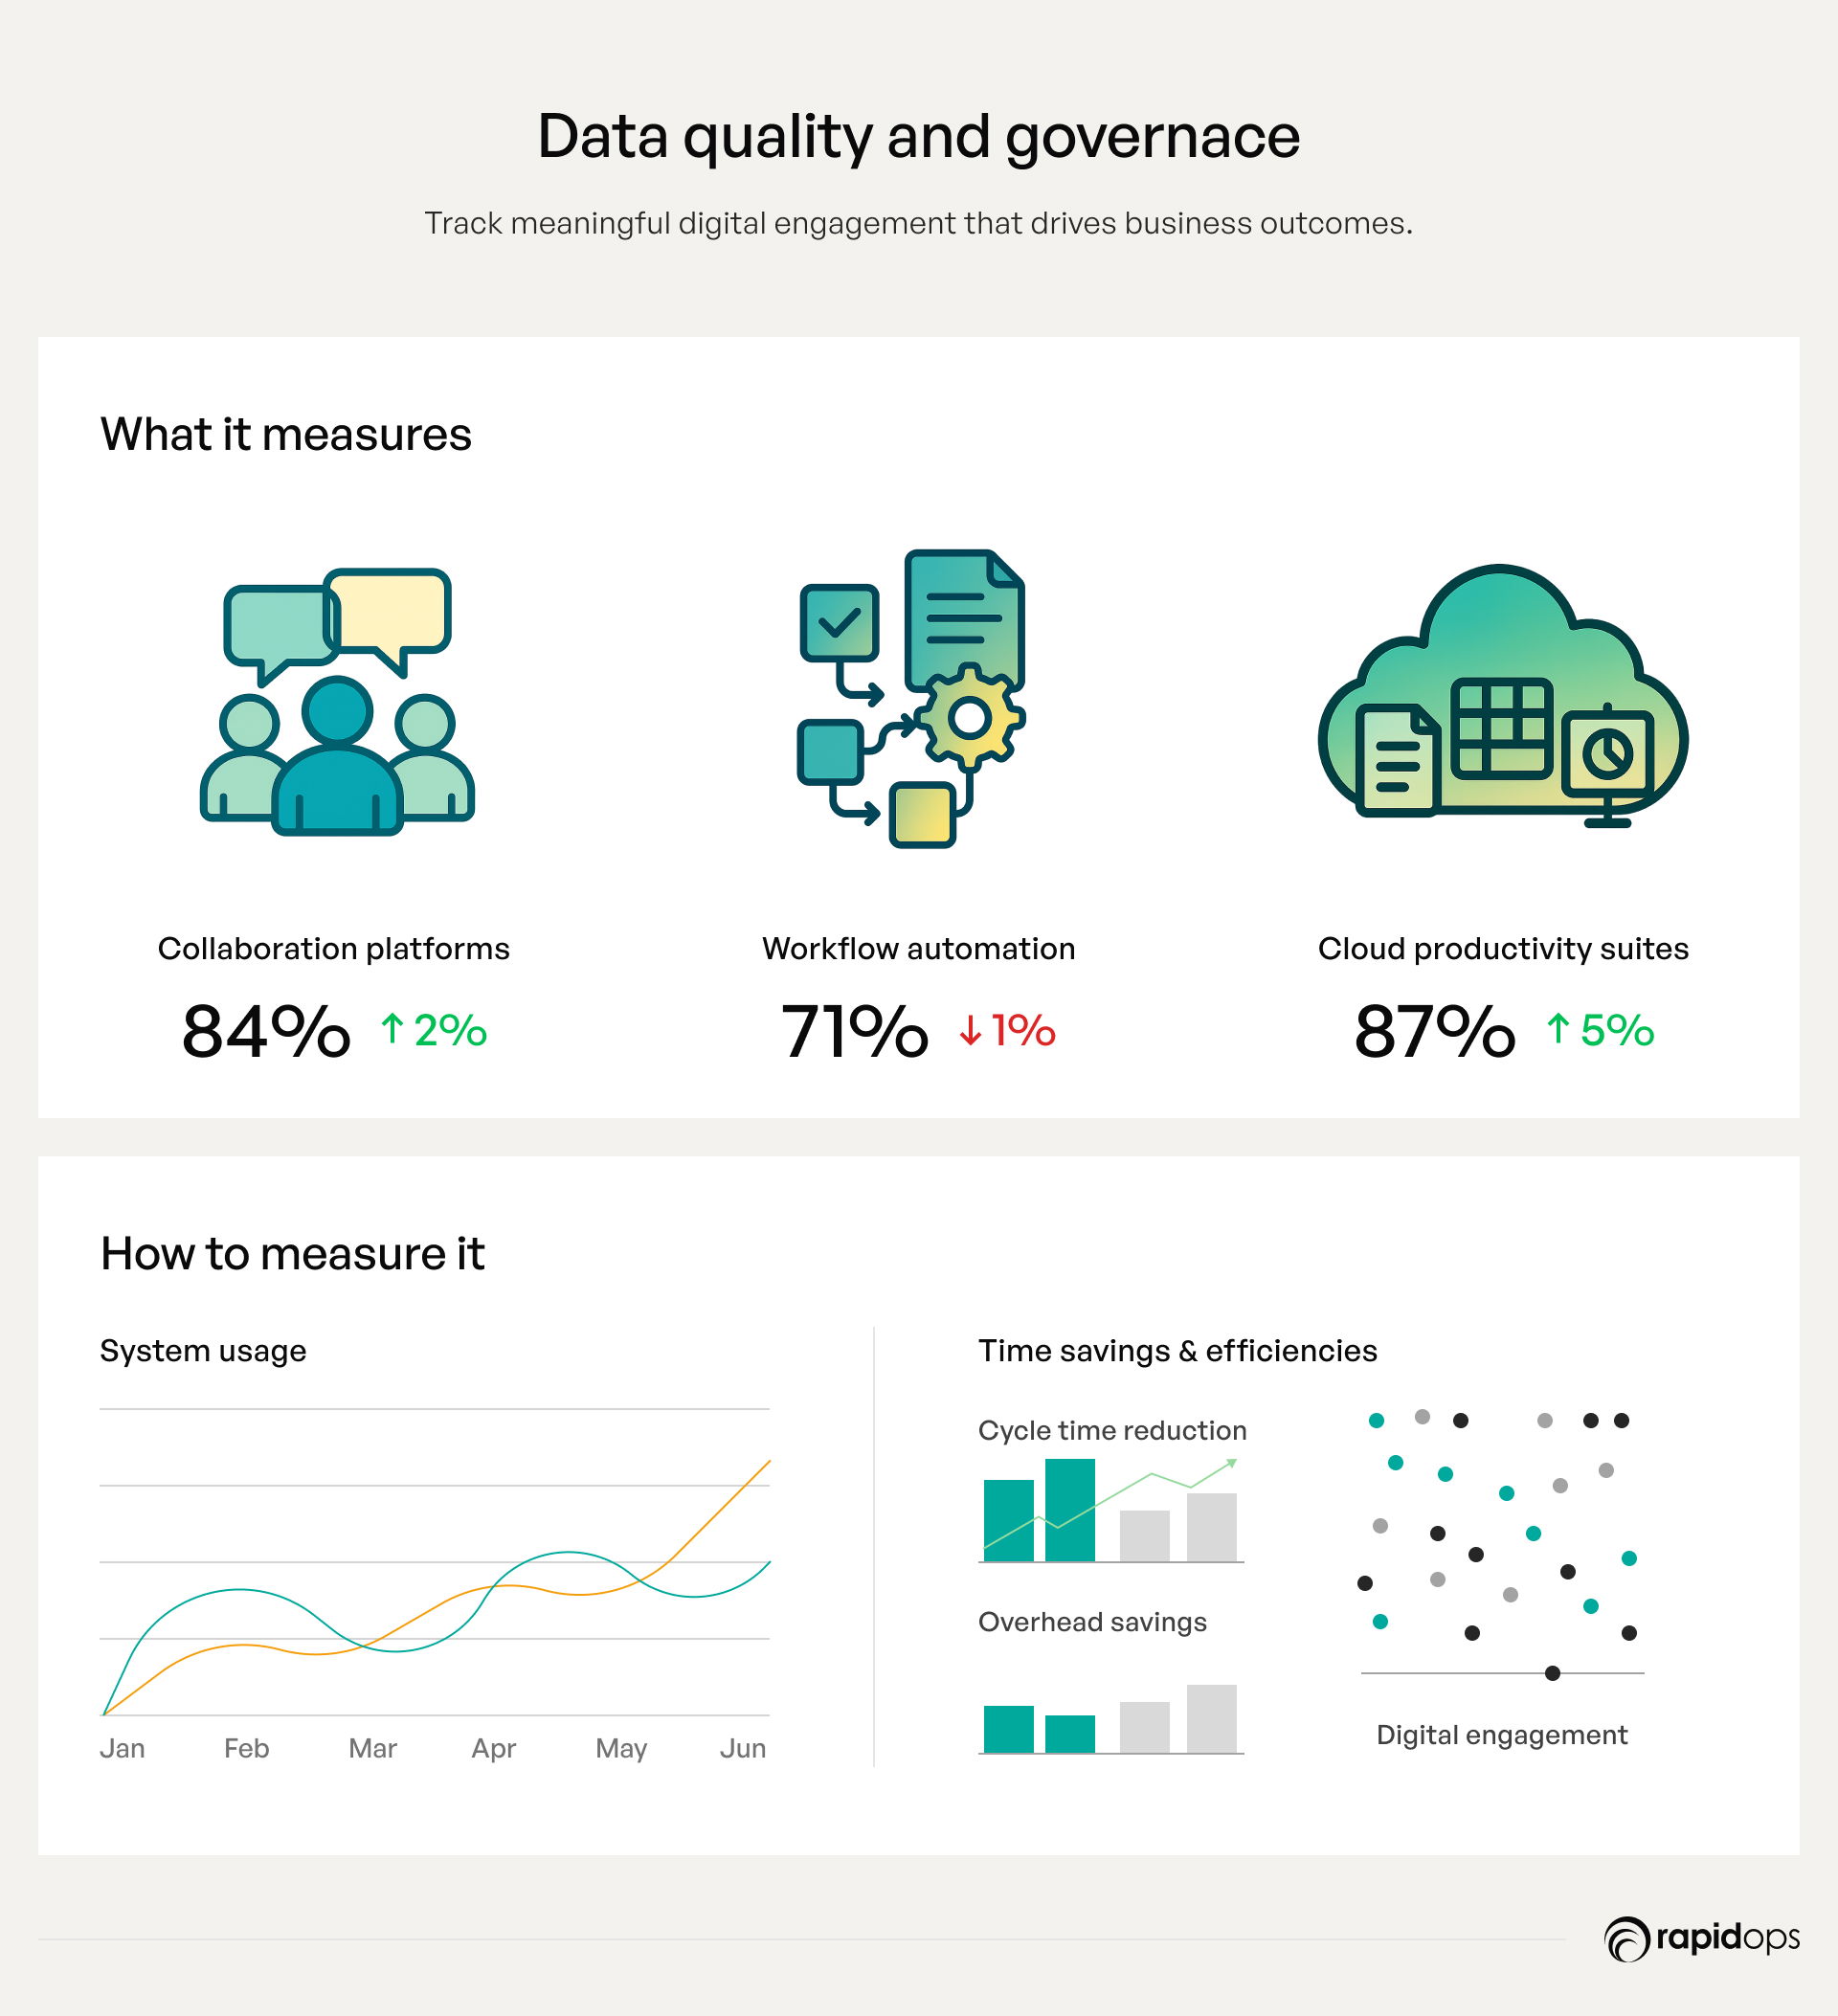
9. Data quality and governance
Data quality and governance assess the reliability, accuracy, and compliance of your information, ensuring decisions are built on trustworthy and well-managed data assets.
What it measures
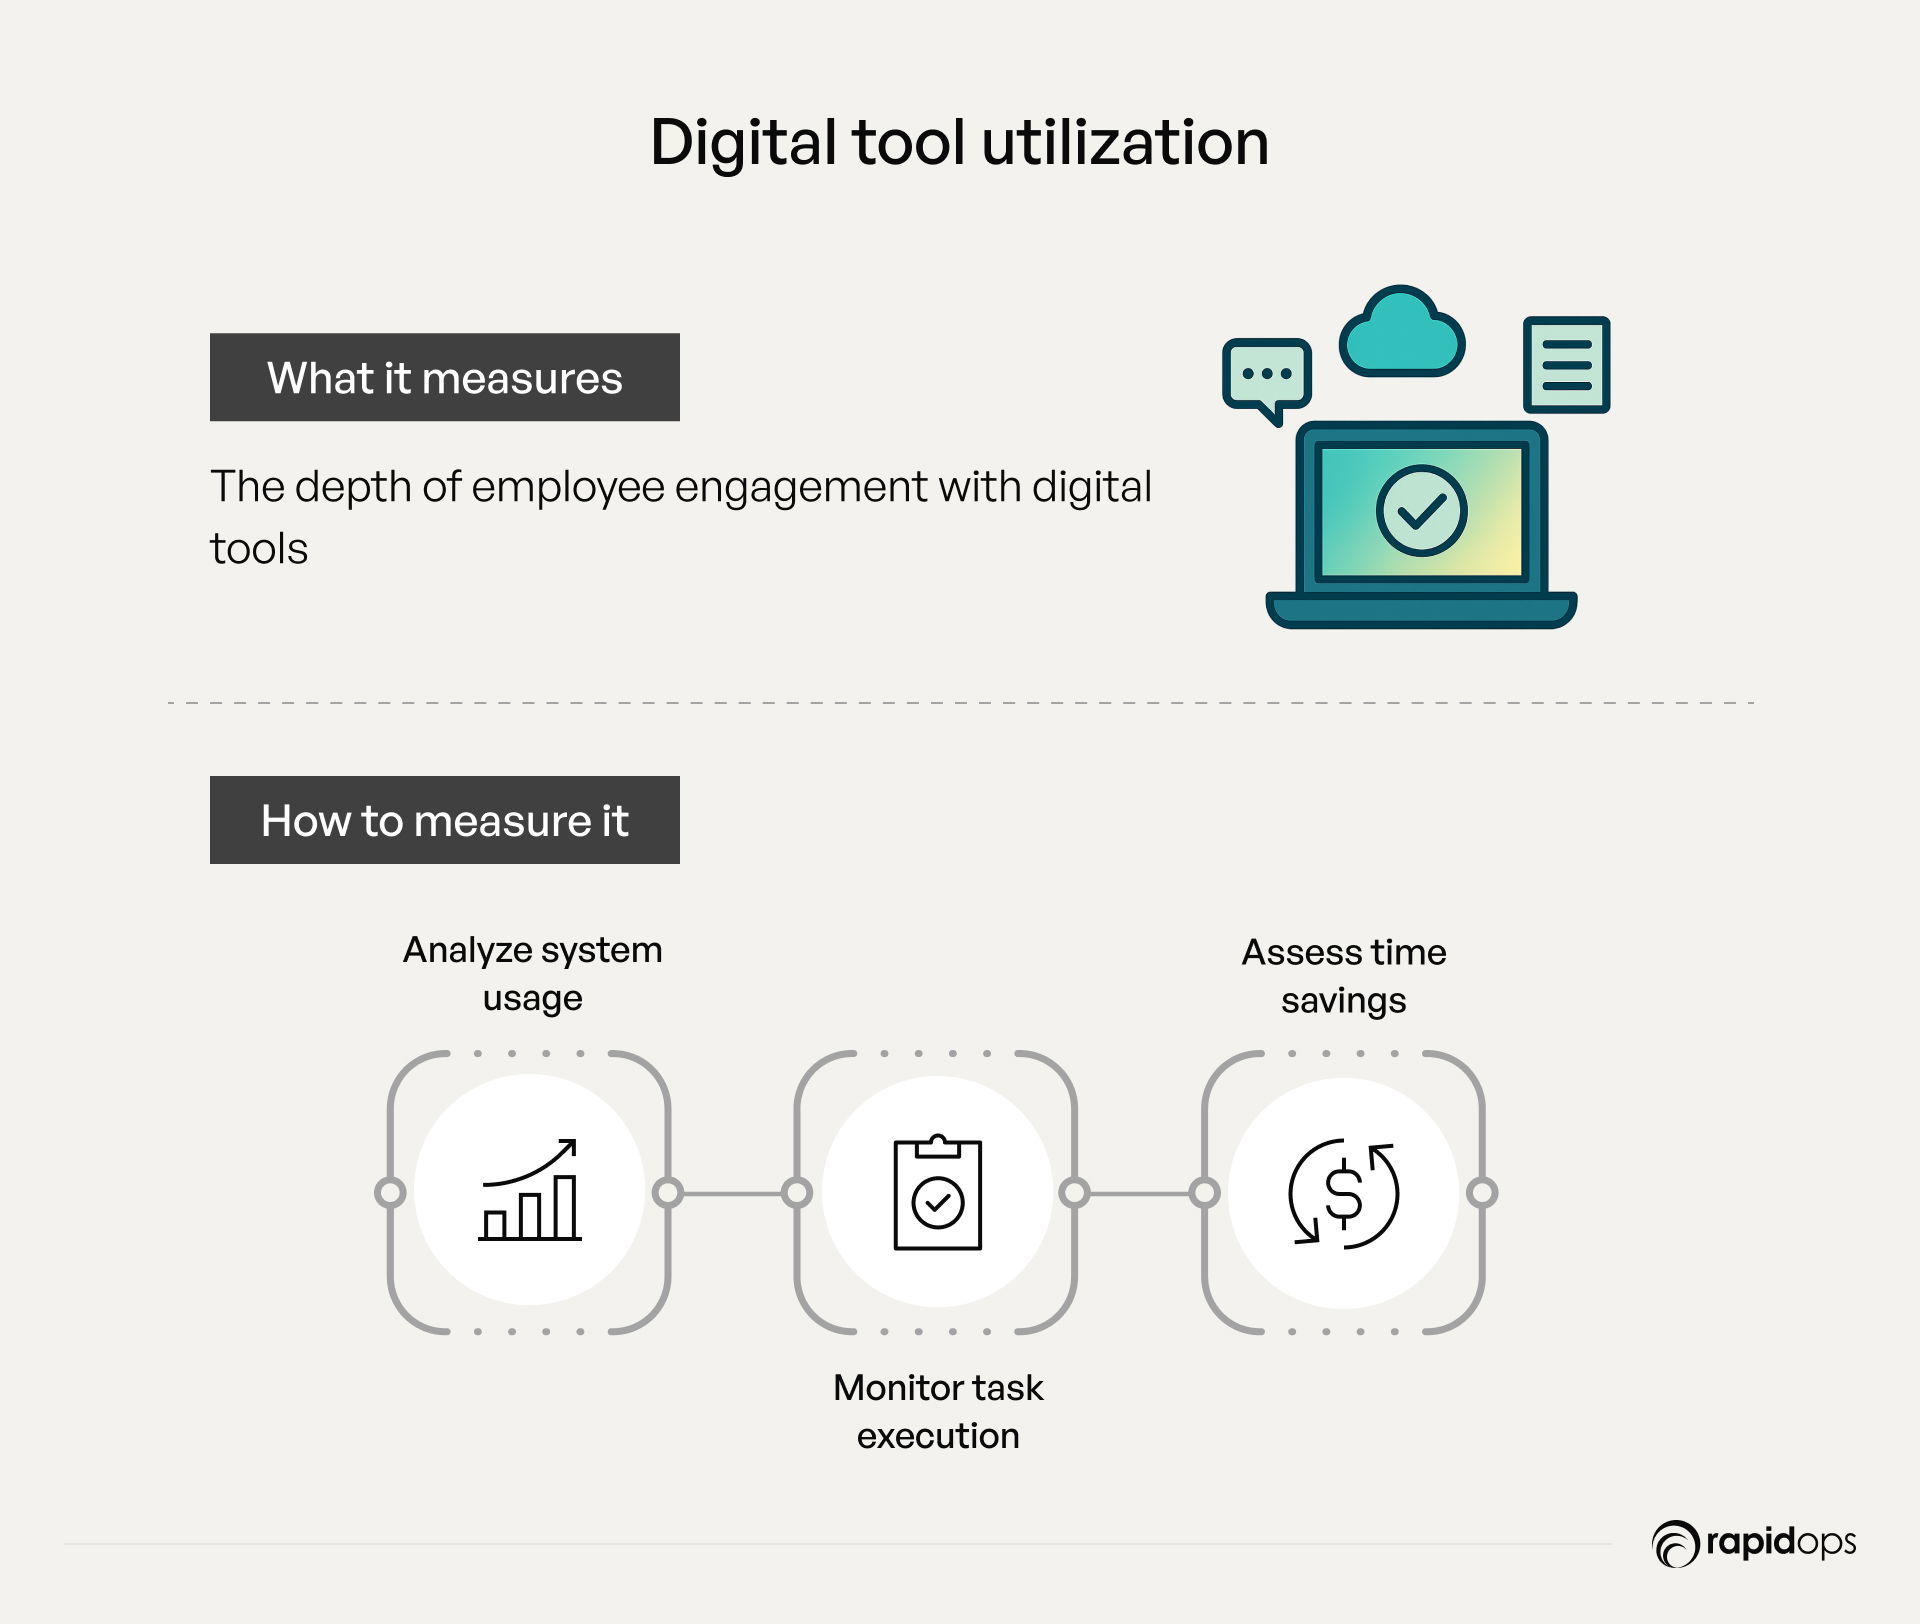
This metric evaluates the consistency and effectiveness with which employees utilize digital tools, including collaboration platforms, workflow automation systems, and cloud-based productivity suites.
It reveals the depth of digital integration in day-to-day operations, beyond mere access; it highlights meaningful usage that contributes to business outcomes.
Why it matters
High utilization signals that digital tools are not only deployed but are driving real behavioral change across the organization. It’s a strong indicator of successful change management, digital readiness, and productivity gains.
Conversely, low engagement may highlight issues with user experience, training gaps, or cultural resistance, critical friction points that can stall broader transformation goals.
How to measure it
To evaluate this digital transformation metric effectively:
- Analyze system usage data: Track user logins, active session durations, and feature engagement across platforms like Slack, Microsoft Teams, Jira, or workflow automation tools.
- Monitor task execution trends: Measure the frequency at which employees complete core tasks digitally versus manually (e.g., approvals, document sharing, project updates).
- Assess time savings and efficiencies: Identify reductions in cycle time and administrative overhead resulting from the use of digital tools.
- Correlate with business KPIs: Where possible, link tool usage with performance metrics, such as time-to-completion or error rates, to validate the impact.
How to track progress over time
- Weekly or monthly reporting: Leverage dashboards and analytics from IT teams or software vendors to generate ongoing usage insights.
- Segment by department or role: Identify adoption gaps or training needs in specific teams or business units.
- Benchmark trends: Compare usage against organizational targets or industry peers to assess maturity and ROI.
10. Digital maturity index
Digital maturity index evaluates how effectively an organization integrates technology, culture, and processes to drive growth, efficiency, and competitive advantage.
What it measures
The digital maturity index (DMI) is a composite indicator that evaluates an organization’s overall digital readiness and progress.
It aggregates key dimensions such as digital capabilities, data maturity, leadership alignment, cultural adaptability, and technological infrastructure.
This metric helps organizations gauge not just how much they’ve transformed, but how well their ecosystem is equipped to scale and sustain digital initiatives.
Why it matters
The digital maturity index is one of the most strategic metrics for digital transformation. It goes beyond isolated KPIs by offering a multi-dimensional view of progress.
A high maturity score indicates a digitally fluent organization, capable of leveraging technology, data, and agile processes to drive innovation and competitiveness.
Conversely, a low score signals structural gaps that may hinder transformation ROI, agility, or resilience.
How to measure it
To measure the digital maturity index:
- Use structured frameworks: Leverage established models from McKinsey, BCG, or Deloitte, or build a custom internal framework tailored to your sector and business model.
- Assess key domains: Evaluate capabilities across leadership commitment, cultural adaptability, customer experience, data governance, technology stack, and talent readiness.
- Score and weight: Assign quantitative or qualitative scores to each dimension, weighted based on strategic priorities.
- Engage stakeholders: Include input from cross-functional leaders to ensure objectivity and alignment.
How to track progress over time
- Annual benchmarking: Conduct a full DMI assessment yearly to track progress across all dimensions.
- Compare against industry standards: Benchmark your score against peers or industry leaders to identify where you’re ahead or falling behind.
- Use as a strategic planning tool: Align future digital initiatives with maturity gaps to drive focused investment and capability development.
Make your digital efforts count with metrics that matter
As you progress in your digital journey, you’ve likely made significant investments, but measuring their true impact may still feel unclear. Maybe data is scattered across different tools, or you’re tracking metrics that don’t tie back to strategic goals. Perhaps there’s activity, but it's unclear whether it’s truly making a difference.
The real gap lies not in ambition, but in alignment.
At Rapidops, with over 16 years of experience helping industry pioneers succeed in digital transformation, we specialize in co-creating measurement frameworks that align directly with your business objectives. We don’t just provide dashboards; we ensure the metrics you track are tied to meaningful value, whether it’s faster time-to-market, higher adoption, reduced inefficiencies, or enhanced customer experiences.
No matter where you are in your digital journey, we tailor our approach to ensure your metrics track real progress and deliver actionable insights that drive transformation. Let’s define the metrics that move you forward. Book a strategy call with us to gain clarity on what success looks like and how to measure it, confidently and continuously, driving real, impactful outcomes.

What’s Inside
- Establishing a strategic foundation before defining metrics
- 10 key metrics to measure digital transformation progress
- 1. Digital revenue contribution
- 2. Return on digital investment (RODI)
- 3. Digital adoption rate
- 4. Operational efficiency gains from digital tools
- 5. Time to market for digital products or features
- 6. Percentage of processes digitized
- 7. Digital customer experience score (or Digital NPS)
- 8. Innovation and digital ecosystem expansion
- 9. Data quality and governance
- 10. Digital maturity index
- Make your digital efforts count with metrics that matter

Let’s build the next big thing!
Share your ideas and vision with us to explore your digital opportunities
Similar Stories
- Transformation
- undefined Mins
- March 2022


- Transformation
- undefined Mins
- March 2020

Receive articles like this in your mailbox
Sign up to get weekly insights & inspiration in your inbox.